


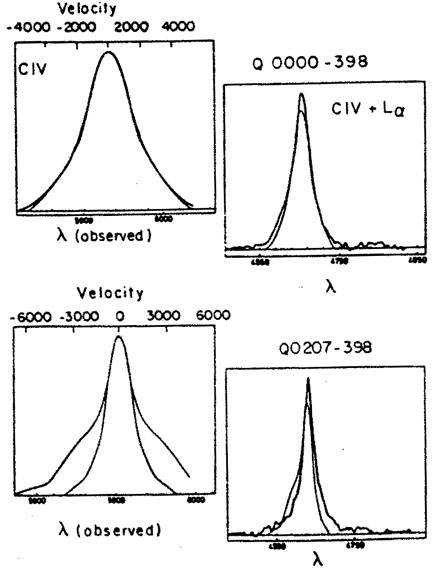
2.3 Line Profiles
There are two distinct classes of line profiles, narrow (200-1000 km s-1) and broad (1500-10,000 km s-1), that seem to come from two distinct emission line regions. They are present, in different proportion, in different AGNs. Even the narrow emission lines are too broad to be interpreted as due to pure thermal motion. The gas producing the lines must be moving at high speed and a given wavelength in a profile is associated with a given projected velocity. Thus studying the line profiles is a way for understanding the gas motion in the nucleus.
|
Figure 4. Broad emission line profiles in
two quasars. Left: CIV |
Different AGNs can differ a lot in their line profiles. In some objects the broad emission lines of different ions have similar profiles, in others the profiles are quite different. Some broad line profiles are symmetric and others are not. The narrow emission line profiles of many objects show a clear blue asymmetry which seems to depend on the gas density and/or its level of ionization. In some objects the lines have smooth profiles, in others there is a clear evidence for a multi-component structure. Even the line center redshift is not always the same for all lines and in some high luminosity objects the broad high ionization lines are blue-shifted with respect to the broad low ionization lines. Several examples of line profiles are shown in Figs. 4 and 5 and others are discussed later. All this information must be considered when modeling the gas motion and dynamics in AGNs, which is the subject of chapter 9.
|
Figure 5.
H |
 1549
with its reflection superposed. Right: Superposition of
CIV
1549
with its reflection superposed. Right: Superposition of
CIV . Note the very asymmetric
CIV
. Note the very asymmetric
CIV profiles in a low
redshift quasar
(courtesy of G. Stirpe).
profiles in a low
redshift quasar
(courtesy of G. Stirpe).