


Cyg A = 3C 405 is one of the brightest radio sources
in the sky, a cD
galaxy known from the work of Baade and Minkowski
[11] to have very
strong emission lines. Miller and I
[12] measured the
relative
intensities of 24 emission lines in its spectrum, the strongest being
[O III]  5007 and [N II]
6583. A very wide range of
ionization is
observed from [O I], (N, I], and [S II] all the way to [Ne V], [Fe
VII] and [Fe X]. The latter is represented by
6374, which was
reported to be present by Baade and Minkowski because the wavelength
of [O I] 6364 which they
measured was too large. It can definitely be
seen to be present in our scans, both from the asymmetric form of the
blended profile and from its relative intensity with respect to [O I]
6300. [Fe XIV]
5303 could not be detected in
our spectra, but the
upper limit we could place on it is only a trifle smaller than the
measured [Fe X] 6374
strength. In a general way, the emission lines
detected in Cyg A, particularly those of intermediate ionization, are
the same lines that are strong in planetary nebulae and H II regions,
implying that the abundances of the elements, temperatures, and
densities are not vastly different in these classes of objects,
although this subject is treated in more detail in my other paper in
this symposium.
5007 and [N II]
6583. A very wide range of
ionization is
observed from [O I], (N, I], and [S II] all the way to [Ne V], [Fe
VII] and [Fe X]. The latter is represented by
6374, which was
reported to be present by Baade and Minkowski because the wavelength
of [O I] 6364 which they
measured was too large. It can definitely be
seen to be present in our scans, both from the asymmetric form of the
blended profile and from its relative intensity with respect to [O I]
6300. [Fe XIV]
5303 could not be detected in
our spectra, but the
upper limit we could place on it is only a trifle smaller than the
measured [Fe X] 6374
strength. In a general way, the emission lines
detected in Cyg A, particularly those of intermediate ionization, are
the same lines that are strong in planetary nebulae and H II regions,
implying that the abundances of the elements, temperatures, and
densities are not vastly different in these classes of objects,
although this subject is treated in more detail in my other paper in
this symposium.
The emission lines in Cyg A all have similar profiles, with full widths at half maximum of approximately 500km/s. The H I Balmer lines have a very steep gradient, and since for a very wide range of electron temperatures and densities we expect the emitted decrement to fall within the relatively narrow range predicted by the recombination theory, the only plausible interpretation is that the observed line strengths have been strongly modified by interstellar extinction. The amount of extinction derived from the H I line corresponds to about EB-V = 0.7 magnitudes, assuming the standard Whitford reddening curve. All the measured emission-line strengths were corrected with this reddening to derive the relative line intensities as emitted in Cyg A.
The continuous spectrum of Cyg A shows no detectable absorption lines whatsoever at our resolution. The observed continuous spectrum approximately fits a power-law
with n = 2.7, or if the correction for interstellar extinction derived
from the H I emission lines is also applied to the continuum, n =
1.6.
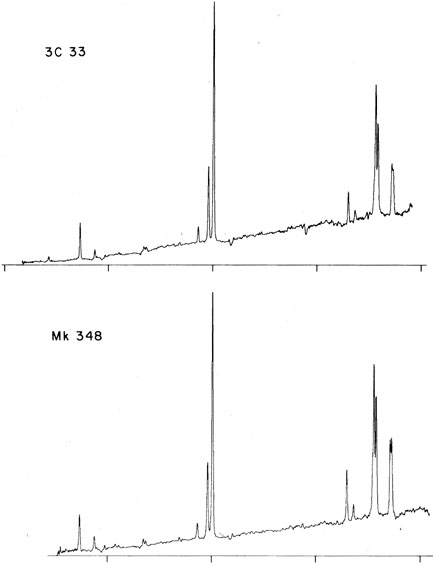
Figure 1. Upper - measured spectrum of
narrow-line radio galaxy 3C 33; lower - measured spectrum of Seyfert 2
galaxy Mrk 348. Both spectra plotted in relative energy
units per unit frequency interval versus wavelength.
Spectrophotometric measurements of several other "narrow-line radio
galaxies" similar to Cyg A have been carried out and reported by
Costero and myself [13]
and by Koski [14,
15]. All these radio
galaxies have emission lines with widths similar to the widths in
Cyg A, ranging between about 400 km/s and 800km/s in
various members of
the group. Most of them have emission-line spectra similar to that of
Cyg A, though weaker by various amounts with respect
to their
continuous spectra. A few of the narrow-line radio galaxies have
emission-line spectra indicating a generally lower level of
ionization, with [O III]
Figure 2. Measured spectrum of narrow-line
radio galaxy PKS 2322-12 in relative energy units per unit frequency
intervarl versus wavelength.
All the narrow-line radio galaxies we have observed except
Cyg A
have detectable absorption lines in their spectra, the lines most
easily seen being Mg I
 = C
-n
= C
-n
5007 weaker with respect to
H , and [O II]
3727 stronger. An example is
PKS 2322-12, whose spectrum is shown in
Fig. 2. However this object, and other
narrow-line radio galaxies we
have observed with similar low average levels of ionization, could not
be mistaken for typical H II regions or low-ionization planetary
nebulae, because [O I] 6300, 6364 and [S II]
6717, 6731 are much
stronger in the radio galaxies than in any H II region or planetary
nebula.
, and [O II]
3727 stronger. An example is
PKS 2322-12, whose spectrum is shown in
Fig. 2. However this object, and other
narrow-line radio galaxies we
have observed with similar low average levels of ionization, could not
be mistaken for typical H II regions or low-ionization planetary
nebulae, because [O I] 6300, 6364 and [S II]
6717, 6731 are much
stronger in the radio galaxies than in any H II region or planetary
nebula.

5190
and Ca II H and K. In many cases a
detailed comparison shows that many more lines of an underlying galaxy
can be seen, but in general the equivalent widths of the absorption
lines in the radio-galaxy spectra are smaller than in typical
galaxies. Evidently the optical spectra of radio galaxies we have
observed can be described as combining an emission-line spectrum, a
featureless continuum, and an absorption-line galaxy
spectrum. Quantitative measurements by Koski
[14]
indicate that the
featureless ("power-law") continuum makes up from 0.1 to 0.7 of the
total continuous spectrum at
H in the objects he
observed. In several
of the narrow-line radio galaxy spectra, H I absorption lines can be
seen in the near ultraviolet, indicating the presence of more early
type stars than in typical galaxies. These features do not occur in
all narrow-line radio galaxies; in some the absorption-line spectrum
is a very good match indeed to the absorption-line spectrum of a
normal elliptical galaxy.