


 m
m
 0.4
0.4
We have already mentioned that the
m = 1 CHDM model with
 = 0.2 was found to be the best fit to nearby galaxy data of
all cosmological models
[3]. But this
didn't take
into account the new high-z supernova data and analyses
[96]
leading to the conclusion that
= 0.2 was found to be the best fit to nearby galaxy data of
all cosmological models
[3]. But this
didn't take
into account the new high-z supernova data and analyses
[96]
leading to the conclusion that
 -
matter
0.2, nor the new
high-redshift galaxy data. Concerning the
latter, Somerville, Primack, and Faber
[97] found that
none of
the m = 1 models
with a realistic power spectrum (e.g., CHDM,
tilted CDM, or
-
matter
0.2, nor the new
high-redshift galaxy data. Concerning the
latter, Somerville, Primack, and Faber
[97] found that
none of
the m = 1 models
with a realistic power spectrum (e.g., CHDM,
tilted CDM, or  CDM) makes anywhere
near enough bright z ~ 3
galaxies. But we found that
CDM with
m
0.4 makes
about as many high-redshift galaxies as are observed
[97]. This
m value is also
implied if clusters have the same baryon
fraction as the universe as a whole:
m
b / fb
0.4, using for the
cosmological density of ordinary matter
b = 0.019
h-2
[98] and for
the cluster
baryon fraction fb = 0.06 h-3/2
[99] from X-ray data
or fb = 0.077 h-1 from
Sunyaev-Zel'dovich data
[100].
An analysis of the cluster abundance as a function
of redshift based on X-ray temperature data also implies that
m
0.44 ± 0.12
[101,
102].
Thus most probably m is
~ 0.4 and there is a cosmological constant
~
0.6. In the 1984 paper that helped launch CDM
[14], we
actually considered two models in parallel, CDM with
m = 1 and
CDM with
m = 0.2 and
= 0.8, which we thought
would bracket the possibilities. It looks like an
CDM intermediate
between these extremes may turn out to be the right mix.
CDM) makes anywhere
near enough bright z ~ 3
galaxies. But we found that
CDM with
m
0.4 makes
about as many high-redshift galaxies as are observed
[97]. This
m value is also
implied if clusters have the same baryon
fraction as the universe as a whole:
m
b / fb
0.4, using for the
cosmological density of ordinary matter
b = 0.019
h-2
[98] and for
the cluster
baryon fraction fb = 0.06 h-3/2
[99] from X-ray data
or fb = 0.077 h-1 from
Sunyaev-Zel'dovich data
[100].
An analysis of the cluster abundance as a function
of redshift based on X-ray temperature data also implies that
m
0.44 ± 0.12
[101,
102].
Thus most probably m is
~ 0.4 and there is a cosmological constant
~
0.6. In the 1984 paper that helped launch CDM
[14], we
actually considered two models in parallel, CDM with
m = 1 and
CDM with
m = 0.2 and
= 0.8, which we thought
would bracket the possibilities. It looks like an
CDM intermediate
between these extremes may turn out to be the right mix.
The success of
m = 1 CHDM in
fitting the CMB and galaxy distribution data suggests that flat
low-m cosmologies with a
little hot dark matter be investigated in more detail. We
have used CMBFAST
[64]
to examine CHDM models with various
h,
m, and
, assuming
b = 0.019
h-2.
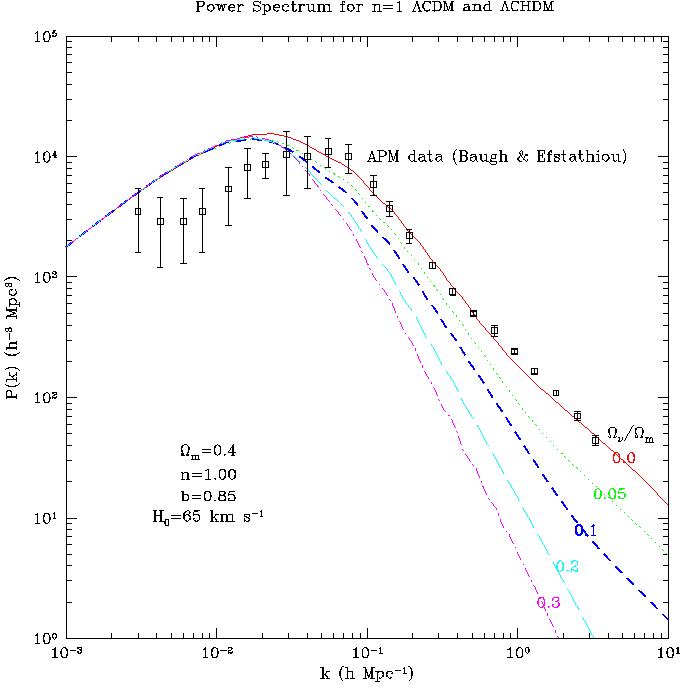
Figure 1 shows the power spectrum P(k)
for CDM and a sequence
of CHDM models with
increasing amounts of hot dark matter, compared
to the power spectrum from APM
[108].
Here we have fixed
m = 0.4 and Hubble
parameter h = 0.65. All
of these models have no tilt and the same bias parameter, to make it
easier to compare them with each other. As expected, the large-scale
power spectrum is the same for all these models, but the amount
of small-scale power decreases as the amount of hot dark matter
increases.
|
Figure 1.
Nonlinear dark matter power spectrum vs. wavenumber for
|
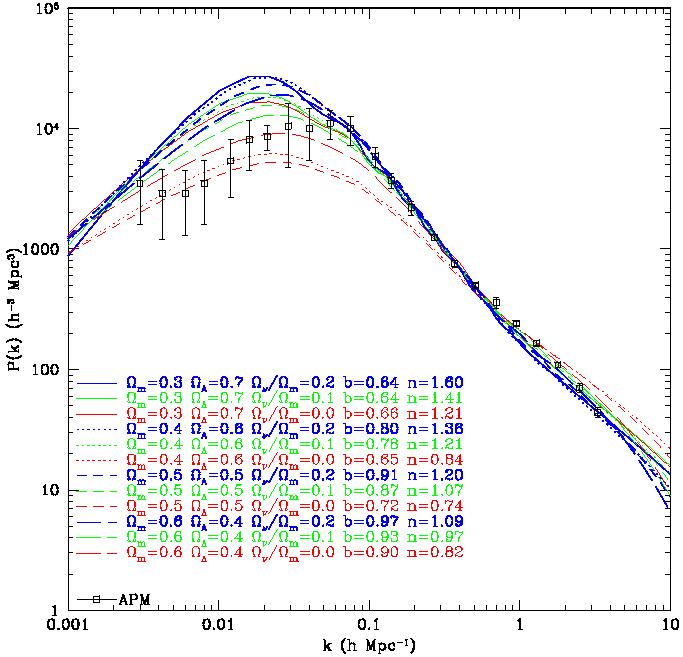
In Figures 2 and 3 we
consider a sequence of twelve
CDM and
CHDM
models with h = 0.65,
m = 0.3, 0.4, 0.5,
0.6, and
/
m = 0, 0.1, and 0.2.
We have adjusted the amplitude and tilt n of the primordial
power spectrum for each model in order to match the 4-year COBE amplitude
and the ENACS differential mass function of clusters
[109]
(cf. [110]).
(We checked the CMBFAST calculation of
CHDM models against
Holtzman's code used in our earlier investigation of
CHDM models
[1]. Our
results are also compatible with those of recent studies
[111,
112]
in which n = 1 models were considered. But we
find that some CDM and
CHDM models require n
> 1, called ``anti-tilt'', and
it is easy to create cosmic inflation models that give n > 1 -
cf. [113].)
In all the CHDM models the
neutrino mass is
shared between N =
2 equal-mass species - as explained above, this
is required by the atmospheric neutrino oscillation data if neutrinos
are massive enough to be cosmologically significant hot dark matter.
(This results in slightly
more small-scale power compared to
N = 1 massive
species, as explained above, but the
N = 1 curves are
very similar to those shown.)
In Ref. [114]
we have shown similar results for Hubble
parameter h = 0.6, and also plotted the best CHDM and
CDM
models from [3].
Note that all these Figures are easier to read in color; see the version
of this paper on the Los Alamos archive
[115].
|
Figure 2.
Nonlinear dark matter power spectrum vs. wavenumber for 12
|
|
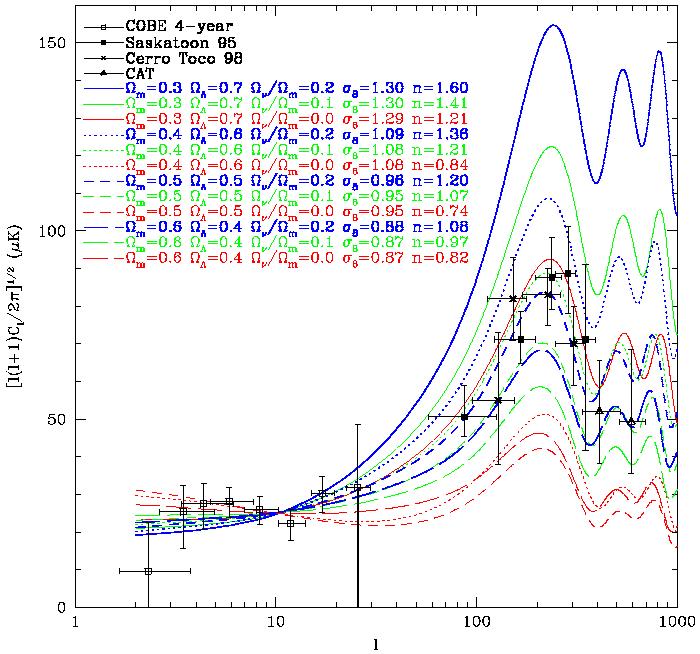
Figure 3. CMB anisotropy power spectrum vs. angular wave number for the same models as in Figure 2. The data plotted are from COBE and three recent small-angle experiments [104, 105, 106, 107]. |
Of the CHDM models shown, for
m = 0.4 - 0.6 the best
simultaneous fits to the small-angle CMB and the APM galaxy power
spectrum data [108]
are obtained for the model with
/
m = 0.1, and
correspondingly
m(µ)
m()
0.8 - 1.2 eV for h = 0.65.
For m < 0.4, smaller
or vanishing neutrino mass appears to be favored.
Note that the anti-tilt permits some of the
CHDM
models to give a reasonably good fit to the COBE plus small-angle CMB data.
Thus, adding a little hot dark matter to
the moderate-m
CDM models may perhaps
improve somewhat their simultaneous
fit to the CMB and galaxy data, but the improvement is not nearly as
dramatic as was the case for
m = 1.
It is apparent that the
CDM models with
m = 0.4, 0.5 have too
much power at small scales (k
 1 h-1
Mpc), as is well known
[117,
118]
- although recent work
[119] suggests that
the distribution of dark matter halos in the
m = 0.3,
h = 0.7 CDM model may
agree well with the APM data. On the other
hand, the CHDM models may
have too little power on small scales -
high-resolution CHDM
simulations and semi-analytic models of early
galaxy formation may be able to clarify this. Such simulations should
also be compared to data from the massive new galaxy redshift surveys
2dF and SDSS using shape statistics, which have been shown to be
able to discriminate between CDM and CHDM models
[120].
1 h-1
Mpc), as is well known
[117,
118]
- although recent work
[119] suggests that
the distribution of dark matter halos in the
m = 0.3,
h = 0.7 CDM model may
agree well with the APM data. On the other
hand, the CHDM models may
have too little power on small scales -
high-resolution CHDM
simulations and semi-analytic models of early
galaxy formation may be able to clarify this. Such simulations should
also be compared to data from the massive new galaxy redshift surveys
2dF and SDSS using shape statistics, which have been shown to be
able to discriminate between CDM and CHDM models
[120].
Note that all the CDM and
CHDM models that are normalized to
COBE and have tilt compatible with the cluster abundance are a poor
fit to the APM power spectrum near the peak. The
CHDM models all
have the peak in their linear power spectrum P(k) higher and at lower
k than the currently available data (e.g., from APM). Thus the
viability of CDM or
CHDM models with a power-law
primordial fluctuation spectrum (i.e., just tilt n) depends on this
data/analysis being wrong. In fact, it has recently been argued
[21]
that because of correlations, the errorbars
underestimate the true errors in P(k) for small k by at least a
factor of 2. The new large-scale surveys 2dF and SDSS will be crucial
in giving the first really reliable data on this, perhaps as early as
next year.
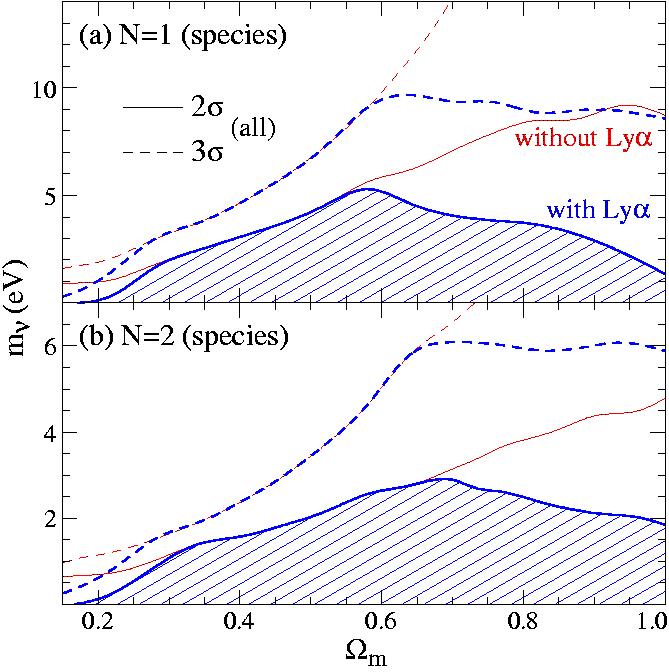
The best published constraint on
in
CHDM models is
[116].
Figure 4 shows the result of
their analysis, which
uses the COBE and cluster data much as we did above, the P(k) data
only for 0.025 (h / Mpc) < k < 0.25 (h / Mpc), the
constraint that the age of the universe is at least 13.2 ± 2.9 Gyr
(95% C.L.) from globular clusters
[122], and also the
power spectrum at high redshift z ~ 2.5 determined from
Lyman- forest data. The
conclusion is that the total neutrino
mass m is less than
about 5.5 eV for all values of
m,
and m
forest data. The
conclusion is that the total neutrino
mass m is less than
about 5.5 eV for all values of
m,
and m
 2.4(m / 0.17-1) eV
for the observationally
favored range 0.2
2.4(m / 0.17-1) eV
for the observationally
favored range 0.2  m
0.5 (both at 95% C.L.).
Analysis of additional Lyman-
forest data can allow detection
of the signature of massive neutrinos even if
m is only a
fraction of an eV. Useful constraints on
will also come
from large-scale weak gravitational lensing data
[123]
combined with cosmic microwave background anisotropy data.
m
0.5 (both at 95% C.L.).
Analysis of additional Lyman-
forest data can allow detection
of the signature of massive neutrinos even if
m is only a
fraction of an eV. Useful constraints on
will also come
from large-scale weak gravitational lensing data
[123]
combined with cosmic microwave background anisotropy data.
|
Figure 4.
Constraints on the neutrino mass assuming (a)
N |
JRP acknowledges support from NASA and NSF grants at UCSC.
 8 determined by COBE +
ENACS cluster abundance. The bias chosen for these models is that
which minimizes
8 determined by COBE +
ENACS cluster abundance. The bias chosen for these models is that
which minimizes  2 over
the entire range of available APM data.
2 over
the entire range of available APM data.