

1.1. Determination of the CFIRB above 100 µm: another Approach
In the parts of the sky with no molecular clouds or dense HII regions, the far-IR emission can be written as the sum of dust emission associated with the neutral gas and with the diffuse ionised gas, interplanetary dust emission, the CFIRB, and the cosmic microwave background and its dipole. In previous studies (Puget et al. 1996; Fixsen et al. 1998; Hauser et al. 1998), dust emission associated with the ionised gas which could not be traced independently has been either not subtracted properly or neglected.
Lagache et al. (1999)
have for the first time detected dust emission in the ionised gas
and shown that the emissivity (which
is the IR emission normalised to unit hydrogen column density)
of dust in the ionised gas is nearly the same as in the
neutral gas. This has consequences for the determination of the CFIRB.
Following this first detection,
Lagache et al. (2000)
have combined HI and
WHAM H data
(Reynolds et al. 1998)
with far-IR COBE data in order to derive dust
properties in the diffuse ionised gas as well as to make a proper
determination of the CFIRB. After careful pixel selection they describe the
far-infrared dust emission as a function of the HI
and H+ column densities by:
data
(Reynolds et al. 1998)
with far-IR COBE data in order to derive dust
properties in the diffuse ionised gas as well as to make a proper
determination of the CFIRB. After careful pixel selection they describe the
far-infrared dust emission as a function of the HI
and H+ column densities by:

| (1) |
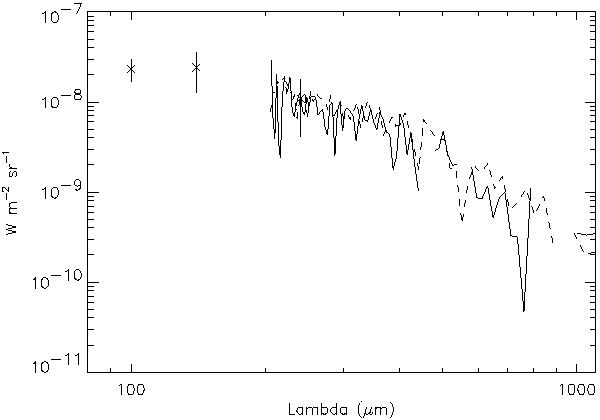
where N(HI)20 cm-2 and N(H+)20 cm-2 are the column densities normalised to 1020 hydrogen atoms and ions per square centimeter respectively. The coefficients A, B and the constant term C are determined simultaneously using regression fits. They show that about 25% of the IR emission comes from dust associated with the diffuse ionised gas which is in very good agreement with the first determination of Lagache et al. (1999). The CFIRB spectrum obtained using this galactic far-infrared emission decomposition is shown in Figure 1 together with the CFIRB FIRAS determination of Lagache et al. (1999) in the Lockman Hole region. We see very good agreement between the two spectra, as well with the Fixsen et al. (1998) determination (Figure 2). Fixsen et al. (1998) used an infrared tracer for the interstellar component which is equivalent as long as the dust emission spectrum from the diffuse neutral and ionised interstellar gas are very similar. This hypothesis is confirmed by the Lagache et al. (2000) analysis.
|
Figure 1. CFIRB spectra obtained from the decomposition of the far-infrared sky (continuous line) and determined for the Lockman Hole region (dashed line) by Lagache et al. (1999). Also reported are DIRBE values at 100, 140 and 240 µm from Lagache et al. (2000). |
|
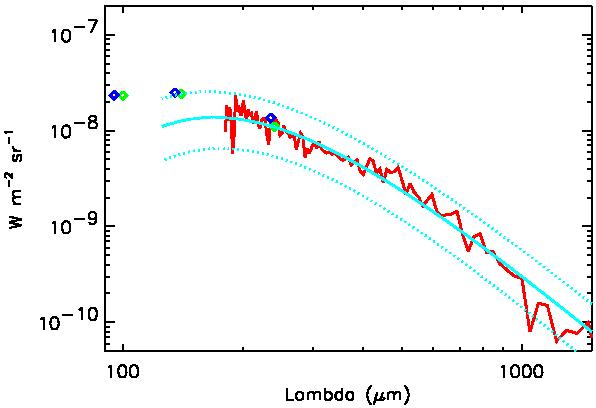
Figure 2. Comparison of the CFIRB determinations: Lagache et al. 2000 (jagged continuous line and light diamonds), Hauser et al. 1998 (dark diamonds, arbitrarily shifted), Fixsen et al. 1998 (dotted and smooth continuous lines). |
At 140 and 240 µm, the values obtained for the CFIRB are 1.13 ± 0.54 MJy/sr and 0.88 ± 0.55 MJy/sr respectively. For each selected pixel, Lagache et al. (2000) compute the residual emission, R = IR - A x N(HI) - B x N(H+). Uncertainties in the CFIRB have been derived from the width of the histogram of R (statistical uncertainties derived from the regression analysis are negligible). The CFIRB values obtained, although much more noisy (due to the small fraction of the sky used), are in very good agreement with the determination of Hauser et al. (1998). At 140 µm, the CFIRB value of Lagache et al. (1999) is smaller than that derived here since the assumed WIM (Warm Ionised gas) dust spectrum was overestimated (the WIM dust spectrum was very noisy below 200 µm and the estimated dust temperature was higher). At 100 µm, assuming an accurate subtraction of the zodiacal emission, the far-IR emission decomposition gives: ICFIRB(100) = 0.78 ± 0.21 MJy/sr. This is the first time that two independent gas tracers for the HI and the H+ have been used to determine the background at 100 µm. The CFIRB value of 0.78 MJy/sr can be compared to the non-isotropic residual emission found by Hauser et al. (1998). The average over three regions of the residual emission, equal to 0.73 ± 0.20 MJy/sr, is in very good agreement with the determination of Lagache et al. (2000).
So we see, using different approaches, that we are now converging on the shape and level of the CFIRB above 100 µm.
1.2. Where are the Main Uncertainties?
There are two main uncertainties in the CIRB (Cosmic InfraRed Background) determination in the IR and sub-mm domain: (1) Dust emission associated with the ionised gas and (2) Zodiacal emission.
If the spectrum of dust associated
with the ionised and neutral gas is the same, a CFIRB
determination using color ratios should give the same values
as other methods implying independent HI and
H gas tracers.
However, one has to note that methods based on
the intercept of the far-IR/HI correlation
for the determination of the CFIRB
are dangerous. For example, for the parts of the sky selected by
Lagache et al. (2000),
this intercept is about 0.91 MJy/sr, which
is quite different from the value of the CFIRB.
The zodiacal emission was obtained by Kelsall et al. (1998) relying on its time variability. Other models have been built for the zodiacal emission which is critical to a determination of the CIRB in the near infrared (Wright 2000; Finkbeiner et al. 2000). The accuracy of these models can be estimated by comparing the residuals observed at wavelengths were the zodiacal emission is maximum (12 and 25 µm). For example, on the one hand, the Kelsall et al. (1998) model leads to residuals of about 4.7 x 10⁻⁷ Wm-2 sr-1 at these wavelengths. On the other hand, upper limits on the CIRB have been established in this wavelength range using TeV gamma rays from extragalactic sources at the level of 10-8 Wm-2 sr-1 (e.g., Biller et al. 1995). This is not in contradiction with the estimate of uncertainties in the Kelsall et al. zodiacal model by Hauser et al. (1998), who give only upper limits for the CIRB. Nevertheless this result, together with the fact that the residuals follow a zodiacal emission spectrum, suggests that this best model underestimates the zodiacal emission as the other contributions (instrumental and interstellar) are significantly smaller. We can thus make a conservative estimate of the amount of zodiacal emission which is not removed by this model at 12 and 25 µm to be 4 x 10⁻⁷ Wm-2 sr-1. The amounts not removed at 60 and 100 µm are thus 4 x 10⁻⁸ Wm-2 sr-1 and 8.4 x 10⁻⁹ Wm-2 sr-1 (using the Kelsall et al. smooth high latitude zodiacal cloud color ratios). This reduces the CIRB at 100 µm from 0.78 to 0.50 MJy/sr. At 60 µm the extra zodiacal emission to be removed (4 x 10⁻⁸ Wm-2 sr-1) is comparable to the residuals, and thus no meaningful value can be obtained on the CIRB at this wavelength.