


3.1. Why Search for the CFIRB Fluctuations?
The CFIRB is taken to consist of sources with number counts as a function of flux which can be represented, for the present discussion, by a simple power law:
| (2) |
Obviously, these number counts need to flatten at low fluxes
to insure a finite value of the background. Thus, we assume that
 = 0
for S < S*, where S* is the flux where the counts flatten.
= 0
for S < S*, where S* is the flux where the counts flatten.
For the simple euclidian case (
= 1.5), the CFIRB integral
is dominated by sources near S* and
its fluctuations are dominated by sources which are just below the detection
limit S0. It is well known that strong cosmological
evolution, associated with a strong negative K-correction, could lead to
a very steep number count distribution (see, for example,
Guiderdoni et
al. 1998 and
Franceschini et
al. 1998).
The present far-IR observations indeed show a very steep slope of
= 2.2
(Dole et al. 2000).
In this case,
the CFIRB integral is still dominated by sources near S*, but
its fluctuations are now also dominated by sources close to
S*. Thus, it is essential to study the
extragalactic background fluctuations, which are likely to have a substantial
contribution from sources with a flux comparable to those dominating the
CFIRB intensity (sources that are not just below the sensitivity limit).
To see if we can detect the CFIRB fluctuations, we need wide field far-IR observations with high angular resolution and very high signal to noise ratio. The FIRBACK project fulfills all these conditions. To search for CFIRB fluctuations, we have first used the so-called ``Marano 1'' field, for which we obtained 4 independent coadded maps which allow us to properly determine the instrumental noise (Lagache & Puget 2000). In this field, we have a signal to noise ratio of about 300 and we detect 24 sources that we remove from the original map. We first carry out an analysis on this field, and then extend it to the other FIRBACK fields.
3.2. CFIRB Fluctuation Mean Level
FIRBACK maps show background fluctuations which consist of two components that we want to separate, galactic cirrus fluctuations and, if present, extragalactic fluctuations.
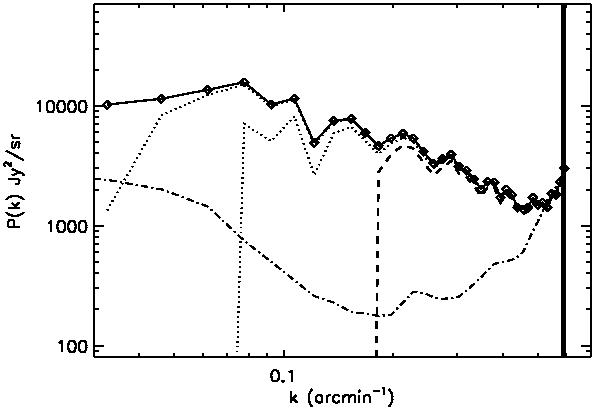
Our separation of the extragalactic and galactic fluctuations is based on a power spectrum decomposition. This method allows us to discriminate between the two components using the statistical properties of their spatial behaviour. Fig. 4 shows the power spectrum of the ``Marano 1'' field. In the plane of the detector, the power spectrum measured on the map can be expressed in the form:

| (3) |
where Pnoise is the instrumental noise power spectrum measured using the 4 independent maps of the Marano 1 field (Lagache & Puget 2000), Pcirrus and Psources are the cirrus and unresolved extragalactic source power spectra respectively, and Wk is the power spectrum of the point spread function, PSF. For our analysis, we remove Pnoise from Pmap.

|
Figure 4. Power spectrum of the source subtracted ``Marano 1'' field (*). The instrumental noise power spectrum (dotted line) has been subtracted. The dashed line represents the cirrus power spectrum multiplied by the power spectrum of the PSF. |
We know from previous work that the cirrus far-infrared
emission power spectrum has a steep slope, Pcirrus
 k-3
(Gautier et al. 1992;
Kogut et al. 1996;
Herbstmeier et al. 1998;
Wright 1998;
Schlegel et al. 1998;
Miville-Deschênes et al. in preparation).
These observations cover the relevant spatial frequency range and have
been recently extended up to 1 arcmin using HI data of very diffuse regions
(Miville-Deschênes 1999).
The extragalactic
component is unknown but certainly much flatter (see the discussion in
Lagache & Puget 2000).
We thus conclude
that the steep spectrum observed in our data at k < 0.15
arcmin-1
(Fig. 4) can only be due to cirrus emission.
The break in the power spectrum at k ~ 0.2 arcmin-1 is
very unlikely to be due to the cirrus emission itself which is
known not to exhibit any preferred scale
(Falgarone et al. 1998).
Thus, the normalisation of our cirrus power spectrum
Pcirrus is directly determined
using the low frequency data points and assuming a k-3
dependence.
k-3
(Gautier et al. 1992;
Kogut et al. 1996;
Herbstmeier et al. 1998;
Wright 1998;
Schlegel et al. 1998;
Miville-Deschênes et al. in preparation).
These observations cover the relevant spatial frequency range and have
been recently extended up to 1 arcmin using HI data of very diffuse regions
(Miville-Deschênes 1999).
The extragalactic
component is unknown but certainly much flatter (see the discussion in
Lagache & Puget 2000).
We thus conclude
that the steep spectrum observed in our data at k < 0.15
arcmin-1
(Fig. 4) can only be due to cirrus emission.
The break in the power spectrum at k ~ 0.2 arcmin-1 is
very unlikely to be due to the cirrus emission itself which is
known not to exhibit any preferred scale
(Falgarone et al. 1998).
Thus, the normalisation of our cirrus power spectrum
Pcirrus is directly determined
using the low frequency data points and assuming a k-3
dependence.

|
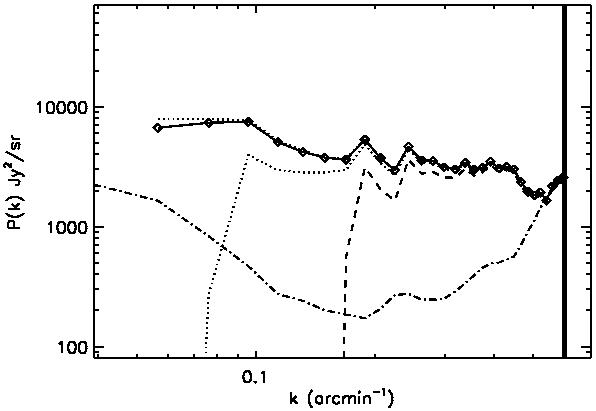
Figure 5. Power spectrum of the FIRBACK/ELAIS N2 field (diamond). The straight continuous and dashed lines, respectively, are the best fit cirrus power spectrum and the spectrum deduced from Miville-Deschênes et al (in preparation). The continuous curve shows the detector noise. |
We clearly see in Figure 4 an excess over Pcirrus between k = 0.25 and 0.6 arcmin-1, which is more than a factor of 10 at k = 0.4 arcmin-1. Any reasonable power law spectrum for the cirrus component multiplied by the footprint leads, as can be easily seen in Fig. 4, to a very steep spectrum at spatial frequency k > 0.2 arcmin-1, which is very different from the observed spectrum. Moreover, the excess is more than 10 times larger than the measured instrumental noise power spectrum. Therefore, as no other major source of fluctuations is expected at this wavelength, the large excess observed between k = 0.25 and 0.6 arcmin-1 is interpreted as due to unresolved extragalactic sources.
|
Figure 6. Power spectrum of the FIRBACK N1 extragalactic component. The continuous curve with diamond symbols represents the residual after the best-fit cirrus power spectrum has been subtracted from the power spectrum of the observational data in this field. The dotted lines represent the residuals after subtraction of the two power spectra of Miville-Deschênes et al., analogous to the two shown in Figure 5 for the N2 field. The dot-dashed line is the detector noise spectrum. The dashed line is the residual extragalactic power spectrum obtained by subtracting 10 times the best-fit cirrus power spectrum from the directly observed power spectrum for this field. |

|
Figure 7. Same as Fig. 6 but for the FIRBACK / ELAIS N2 field. |
The Marano 1 field cannot be used to constrain the clustering of galaxies due to its rather small size. However, the extragalactic source power spectrum mean level can be determined. We obtain Psources = 7400 Jy2/sr, which is in very good agreement with the spectrum predicted by Guiderdoni et al. (1997). This gives CFIRB rms fluctuations around 0.07 MJy/sr (for a range of spatial frequencies up to 5 arcmin-1). These fluctuations are at the ~ 9 percent level, which is very close to the predictions of Haiman & Knox (2000).
The same analysis can be applied to the other and larger FIRBACK fields (N1 and N2). Fig. 5 shows the fluctuation power spectrum (Pmap) obtained for the FIRBACK/ELAIS N2 field in the plane of the sky. Again, we clearly see a large excess over Pcirrus.
From Eq. 3, we deduce:

|
We see in the N1 and N2 fields (Fig. 6 and 7) an increase by a factor of 5 to 10 of Psources from small to large scales. This increase cannot be due to cirrus: for example, the removal of 10 times the cirrus Pk leads to the same increase (dashed line in the two figures). So, it seems that we have with FIRBACK the first indication of IR sources clustering. Although the present analysis cannot be conclusive on this question, it clearly shows that the FIRBACK survey has the required sensitivity and is free enough from contamination to deal with this question.
If we remove from the N1 and N2 maps all detected sources (S >
200 mJy, 5 ),
we obtain CIB fluctuations which are compatible with a Poissonian
distribution (Fig. 8). We need in fact in this
case an independent cirrus
template (like that for the HI gas) to remove the galactic contribution
more correctly and see if correlations are present.
),
we obtain CIB fluctuations which are compatible with a Poissonian
distribution (Fig. 8). We need in fact in this
case an independent cirrus
template (like that for the HI gas) to remove the galactic contribution
more correctly and see if correlations are present.
|
Figure 8. Power spectrum of the FIRBACK/ELAIS N2 unresolved extragalactic component (sources with flux S > 200 mJy have been removed from the maps.) Line symbols are the same as in Fig. 6. |
In summary, we have seen that the fluctuations probe the CFIRB dominant source population. We detect the clustering of the detected FIRBACK sources. On the contrary, the dominant contribution to the CIB fluctuations seems to be compatible with a Poissonian distribution.
It is important to note that the level of the extragalactic fluctuations derived from FIRBACK fields is in very good agreement with the Matsuhara et al. (2000, and this conference) study in the Lockman Hole region, where the interstellar dust contamination is negligible. The presence of correlated extragalactic fluctuations should be studied using all the extragalactic ISOPHOT fields and independent cirrus tracers.