


2.1 Areal and Kinematic Distribution on the sky
Figure 1 shows the distribution of the 2096
galaxies contained in the Virgo Cluster
Catalog (VVC) in BST 85. Figure 2 shows the
subset of the catalog entries which
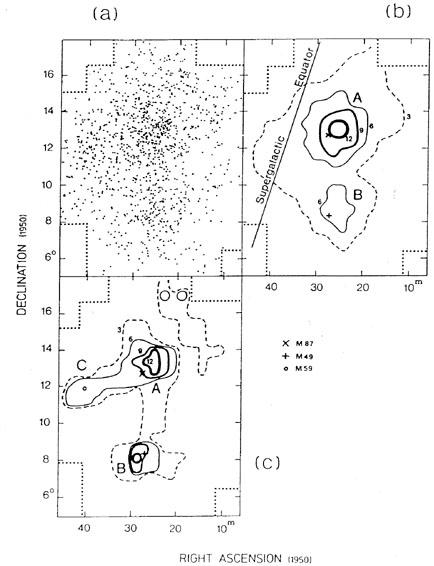
we considered to be cluster members on the basis of galaxy morphology
(cf.
Sandage and Binggeli 1984
for a justification). The important feature of this distribution is its
evident double structure, denoted as subcluster A and subcluster
B. Known already by
de Vaucouleurs (1961)
and discussed in detail by BTS 87, subcluster A near M87 is
E rich and spiral poor relative to subcluster B. There also is a
kinematic difference in
the mean velocities and their dispersions. Subcluster A has < v > =
1061 ± 83 km s-1
with a dispersion of  = 760 km
s-1. Subcluster B has < v > = 963 ± 81 km
s-1 with a
significantly smaller dispersion of 390 km s-1
(Table 4 and Figure 23 of BTS 87).
= 760 km
s-1. Subcluster B has < v > = 963 ± 81 km
s-1 with a
significantly smaller dispersion of 390 km s-1
(Table 4 and Figure 23 of BTS 87).
Of most significance, the dE and Im dwarfs show different distributions over the face of the cluster. Dwarf ellipticals are peaked at sub cluster A, defining its geometrical center. Im types avoid the center of subcluster A, being absent within a radius of 0.7° of it (BTS 87, Figure 10d). There is a similar central hole in the distribution of Im galaxies in Fornax (Ferguson 1989) where the dE dwarfs have their peak concentration.

|
Figure 1. Distribution of all galaxies in the Virgo cluster region that are listed in the catalog of BST 85. Members and background objects are included in this plot. |
Two principal conclusions from the surveys are (1) in both Virgo and Fornax the Im's are absent where the dE's concentrate, and (2) the morphological mix differs fundamentally between Virgo subclusters A and B: E, S0, and dE dwarfs dominate sub cluster A, while spirals are frequent in subcluster B (compare Figures 7 to 10 of BTS 87 where the difference in the morphological mix is striking).
|
Figure 2. The galaxies from Figure 1 that are considered to be Virgo cluster members are plotted in panel (a). Isopleths and isophotoes are in panels (b) and (c). The units on the contours are the number of galaxies per 0.25 square degree in panel (b) and 1010 solar luminosities per square degree in panel (c) calculated assuming a distance modulus of m - M = 31.7. Subclusters A and B are evident. The diagram is from Figure 4 of BTS 87. |
(3) A third conclusion related to (2) concerns the difference in the distribution of spirals and E, S0, and dE galaxies over the 40 square degree Virgo area that was surveyed. Spirals and Im dwarfs are more widely spread than the early type members (BTS 87, Figures 9 and 10 compared with Figures 7 and 8 of the same reference). The result, already known by Zwicky (1957, pp. 78-79) from the brightest galaxies, is striking in the data from the complete catalog. Figure 3 summarizes this fact, shown by fitting assumed exponential decays to the projected density distribution of the early and late type Virgo members separately. The lengths are 1.7 degrees (0.66 Mpc) for the combined E + S0 + dE sample, and 3.3 degrees (1.26 Mpc) for the S + Im sample. The difference is highly significant statistically. These linear scale lengths assume the Virgo distance to be 21.9 Mpc (i.e., m - M = 31.7).
The three conclusions can be summarized as "late type galaxies are more dispersed than early type galaxies: subcluster A is dominated by early types, subcluster B by late types."

|
Figure 3. Radial density profiles for different morphological types fitted with exponential decay lines. The cluster center is assumed to be at R.A. = 12h 15m, Dec. = +13°. The difference in the slopes of the S + Irr and the E + S0 profiles in panel (a) is the principal feature. The diagram is from Figure 16 of BTS 87. |
Five additional conclusions reached by BTS 87 are (4) M87 is not at the center of the swarm of dE members that define the center of subcluster A but lies 40 arc minutes southeast of that center (Figure 8 of BTS 87), (5) the velocity of M87 is 197 km s-1 higher than the mean velocity of subcluster A ,(6) there is no significant difference in the mean velocities of the spirals and the early type galaxies averaged over the 6 degree (radius) field (BTS 87, Table IV), putting to rest an earlier futile debate, (7) the velocity dispersion of early type (E, S0, dE, and dS0) galaxies is significantly smaller (573 km s-1) than for the spiral plus Im types (888 km s-1) (details are in Table IV of BTS 87), (8) the mean "local" velocities of various sub regions over the face of the cluster differ widely (BTS 87, Figure 24), as do the "local" velocity dispersions mentioned earlier (BTS 87, Figure 26). The last four points show that the velocity structure of the Virgo "cluster" is highly complex (cf. also Huchra 1985), differing from that of a regular "isothermal gravitating sphere."
Tully and Shaya (1984), and Tammann and Binggeli (1988) argue that most of these eight points would be untrue for a stationary aggregate that is in virial equilibrium. Tammann and Binggeli show that many of these features are also present in other well studied clusters. Sodre et al. (1989), using kinematic data by Dressler and Shectman (1988), showed that spirals and Im galaxies invariably have a significantly higher velocity dispersion than E and S0 types in a 15 cluster sample studied by them, adding weight to a similar earlier conclusion by Moss and Dickens (1977).
Temporarily leaving this topic of spatial and kinematic distributions, we discuss in the next section a new determination of the luminosity function of Virgo cluster members as a preliminary to comments on the problem of biased galaxy formation in Sections 3 and 4, and the possible transformation of one type of dwarf galaxy into another in Section 6.