

Before discussing possible transformations of one Hubble type into another for any reason in a harsh cluster environment, we need data on the surface brightness (hereafter SB) properties of galaxies of different Hubble types and absolute magnitudes.
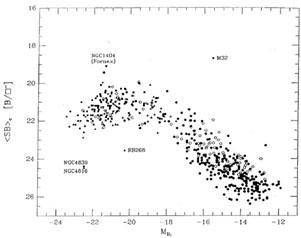
It is well known that the average surface brightness of galaxies decreases along the Hubble sequence from E galaxies through S0's to Sm and Im types (Sandage 1983). Furthermore, within a given Hubble type the average SB varies with absolute magnitude. Within the E and dE types alone the trend with absolute magnitude is most easily revealed in samples taken within particular clusters where all galaxies are at the same distance and where the sampling can be complete. In the Virgo cluster, Binggeli, Sandage, and Tarenghi (1984, hereafter BST 84, their Figure 8) found that the surface brightness of giant E galaxies is faintest for the brightest galaxies, confirming previous results by Kormendy, Oemler, and others. The brightest SB occurs near absolute magnitude MB = -20, decreasing monotonically for the dE types from MB = -19 to the limit of the survey at about MB = -12, and, as mentioned, decreasing also for E galaxies brighter than -20 i.e., there is a maximum SB at the intermediate absolute magnitude of MB = -20 (see Figure 14).
In a more recent review Sandage and Perelmuter (1990, hereafter SP 90) used five independent data sets for E galaxies to obtain the following results.
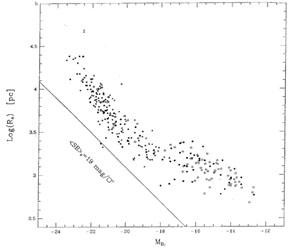
(1) Combining data from the literature for galaxies in the Virgo, Fornax, and Coma clusters with data from field E galaxies from the Revised Shapley-Ames catalog and Sadler's (1984) sample gave the correlation in Figure 13 for E and dE galaxies. Plotted is the half light radius in parsecs (based on m-M = 31.7 for Virgo, 31.9 for Fornax, 35.5 for Coma, and H0 = 50 for the field galaxies) as ordinate vs. absolute blue magnitude. The constant surface brightness m ~ 5logr scaling law of Hubble (1926) is shown as the straight line. It fails to describe the correlation except over the narrow luminosity range from MB = -18 to -21. Galaxies both brighter and fainter than MB = -20 have lower surface brightness than those at -20.

|
Figure 13. Correlation of the effective (half light) radii with absolute magnitude for E and dE galaxies in the Virgo, Fornax, and Coma clusters and in two samples of field E galaxies. Diagram from Sandage and Perelmuter (1990). Open circles are Virgo cluster galaxies, filled circles are for Fornax, filled triangles are for coma, asteri sks are galaxies studied by Sadler, and filled squares are the RSA field galaxy sample. |
(2) Figure 14 is the equivalent diagram showing the variation of surface brightness. The many dE dwarfs discussed by Ferguson (1989) in Fornax are added as closed circles. The trends in this diagram are the same as found by BST 84 (their Figure 8) from a different data sample using different photometry.
Disney and collaborators (cf. Ferguson 1989 for a review) claim that the correlations in Figures 13 and 14 do not exist but are a result of a selection effect. They state (cf. Davies et al. 1988) that our surveys have been biased so that our catalogs have missed low surface brightness cluster members, which, according to them, exist between MB(T) = -20 and -18 in their survey of the Fornax region. Such galaxies would fill SB distribution of Figure 14 to form a scatter diagram showing no correlation of SB with absolute magnitude.

|
Figure 14. Variation of effective surface brightness with absolute magnitude for E and dE galaxies in the same samples as in Figure 13. |
Ferguson and Sandage (1988, hereafter FS 88) answered by showing that the Fornax sample used by Davies et al. contains a large number of galaxies which FS had assigned to the background by inspection of the large scale Las Campanas du Pont plates. The existence of the spiral arms in many of these galaxies is beyond question on these plates. It was also shown that the contaminating galaxies are not concentrated toward the cluster center as are the galaxies classified as members by FS again based on the du Pont plates. Because many of the background galaxies are spirals or luminous background ellipticals, they would fill in the blank regions of Figure 14 if put in that diagram because such galaxies have lower SB values than E galaxies (Sandage 1983) at a given absolute magnitude. However, these galaxies are not members of the Fornax cluster.
It is important to note that Figure 14 contains only E and dE galaxies. Adding galaxies of other Hubble types will destroy the correlation for the reason just given: there is a wide range of SB values along the Hubble sequence at fixed absolute magnitude.
Davies et al. (1988), and Davies, Phillipps, and Disney (1989) make no morphological distinction in their lists, nor do they have information on cluster membership. They have not analyzed their data by restricting the sample to E and dE galaxies nor by reducing the field galaxies in their various lists to the same distance so as to obtain bona fide absolute magnitudes. These problems cloud their criticism of the reality of Figure 14.