


Many of the observing techniques identified in
Table 1 have provided information
about the galactic distribution of Milky Way halo gas. Halo gas spans a
wide range of
physical conditions. It is important to study its distribution using
diagnostic methods
which can adequately sample the many phases of gas believed to be present. For
example, the extensive 21 cm HI measures permit detailed studies of the neutral
component of halo gas while ultraviolet absorption line studies reveal
the neutral,
moderately ionized and highly ionized gas of the halo. Additional
information about
ionized gas in the halo can be inferred from pulsar dispersion studies,
radio free-free absorption studies and diffuse
H emission studies. The very
hot (106 °K) gas of
the halo can in principle be studied through its X-ray emission, and
non-thermal
radio emission measures can be used to trace the presence of high energy
cosmic ray
electrons and the magnetic field in the halo. Below we briefly review
the results of
these different approaches to the study of Milky Way halo gas.
emission studies. The very
hot (106 °K) gas of
the halo can in principle be studied through its X-ray emission, and
non-thermal
radio emission measures can be used to trace the presence of high energy
cosmic ray
electrons and the magnetic field in the halo. Below we briefly review
the results of
these different approaches to the study of Milky Way halo gas.
2.1. HI 21 cm Emission Line Studies
An extensive body of information about halo gas and gas in the outer Milky Way exists in the radio astronomy HI 21 cm literature. For a short overview see Lockman (1986). A significant problem associated with 21 cm emission line measurements of halo gas is the presence of emission by bright HI situated in the radio antenna side lobes. Such emission can often be confused with the emission by low column density halo gas and great care must be exercised to avoid or eliminate the problem. Unfortunately, the vast majority of the papers reporting 21 cm results totally ignore this problem even though it is well documented that the errors can be large (vanWoerden, Takakubo and Braes 1962; Lockman, Jahoda and McCammon 1986).
The z extent of galactic HI varies with radial position in the galaxy. The z distribution for the inner galaxy and solar neighborhood has been studied by Lockman (1984) and Lockman, Hobbs and Shull (1986). Studies of the outer galaxy are found in Knapp, Tremaine and Gunn (1978), Henderson, Jackson and Kerr (1982), Kulkarni, Blitz and Heiles (1982) and Burton and Lintel-Hekkert (1986).
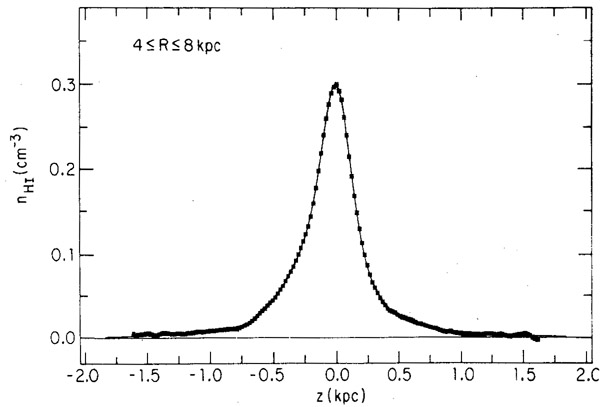
For galactocentric distances R < 3 kpc, the HI layer is narrow and well described by a single Gaussian with FWHM < 0.2 kpc. The inner galaxy does not seem to have HI at large z distances. Starting at about R = 4 kpc the z distribution of the neutral gas layer becomes more complex (see Figure 1) and can be roughly described as a combination of components with exponential scale heights of about 0.12 kpc and 0.5 kpc (see Table 2). The more extended component while recognized in earlier 21 cm studies (Oort 1962; Shane 1971) has, until the work of Lockman and his collaborators, been largely ignored by galactic radio astronomers.
|
Figure 1. The HI volume density versus distance from the galactic plane from Lockman (1984). These results are based on 21 cm emission line data and are averaged over galactocentric distances between 4 and 8 kpc. The data clearly show the extended component of HI in addition to the more familiar disk component of the neutral gas. The scale heights and midplane densities for the various components are listed in Table 2. At small |z| the indicated values of n(HI) (cm-3) underestimate the true values because of optical depth effects. Although the component of HI which extends to high z was first seen by Oort (1962) and Shane (1971), it has been largely ignored until the important recent work of Lockman. |
In the solar neighborhood, a method for evaluating the z extent
of the neutral
halo gas is by intercomparing ultraviolet measures of HI
Ly- absorption to halo
stars at known z distances and HI 21 cm emission data for the
same direction. Larger
column densities from the 21 cm measurements would be expected if gas
exists in the halo beyond the star. From such a program involving 25 stars
Lockman, Hobbs and
Shull (1986)
have shown for high latitude lines of sight that 5 x 10¹⁹
atoms cm-2 or
15 percent of the HI emitting gas exists in the halo with |z| > 1
kpc. The data are
consistent with a two component z distribution consisting of
equal amounts of gas in
a narrow component and an extended component which have scale heights of 0.135
and 0.5 kpc, respectively. The extended component of HI was also
apparent in the results of the Copernicus satellite HI
Ly- and H2 survey
for those sight lines through
the intercloud medium which showed small H2 column densities
(Bohlin, Savage and
Drake 1978).
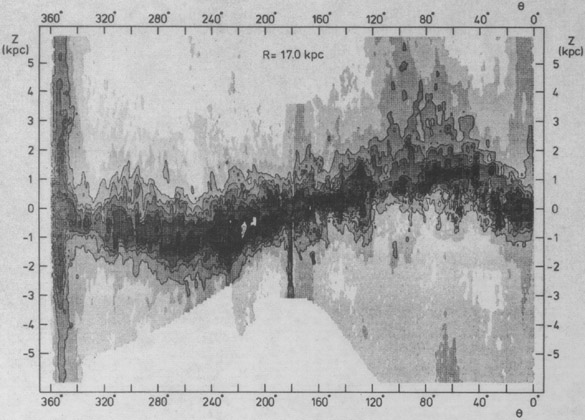
Beyond the solar circle the thickness of the HI layer is observed to increase nearly linearly and at large galactocentric distances (> 20 kpc) the scale height of the gas approaches 1.5 kpc (Kulkarni, Blitz and Heiles 1982; Henderson, Jackson and Kerr 1982). In addition, the gas warps to positive z for galactic latitudes between approximately 60 and 120 degrees and to negative z for galactic latitudes between approximately 150 and 300 degrees. Figure 2 which is from Burton and Lintel-Hekkert (1986) illustrates quite well the large z extension and the warping of gas at a galactocentric distance of 17 kpc.
|
Figure 2. The z extension of HI and
the galactic warp at a galactocentric distance of
17 kpc is illustrated in this figure from
Burton and
Lintel-Hekkert (1986).
The contour divisions occur at values of n(HI) of 0.01, 0.02, 0.03,
0.05, 0.07, 0.16, 0.30, 0.45, 0.6,
0.9, and 1.2 atoms cm-3. Grey scale divisions occur at
levels of 0.001, 0.004, 0.01,
0.02, 0.03, 0.05, 0.07, 0.16, 0.30, 0.45, and 0.60 atoms
cm-3. In this presentation
the dependence of density on galactocentric cylindrical coordinates
(z, |
The actual radial extent of the Milky Way as detected in neutral hydrogen is difficult to estimate reliably because of uncertainties in the galactic rotation curve at large R. Also it is not clear what effect the warp of the galaxy will have on the dynamics of the hydrogen at large galactocentric distances. In summarizing this uncertain subject, Lockman (1986) concludes that it is likely that our Galaxy has a normal sized HI disk with a radius to the neutral hydrogen column density level of 1019 cm-2 of about 30 kpc which is about a factor of 1.5 of the Holmberg radius.
Certain aspects of the intermediate and high velocity cloud phenomena detected in the HI 21 cm emission line relates to galactic halo gas and/or very high z extensions of distant parts of the Milky Way (for a review see Giovanelli 1986). The literature on this subject is very extensive but important to study because the dynamical phenomena which inject gas into the halo may drive a circulation which produces many of the intermediate and high velocity neutral HI clouds (Bregman 1980; Kaelble, deBoer and Grewing 1985).
The very interesting studies of Heiles (1984) of HI bubbles, superbubbles and `worms' provide evidence for the injection of gas into the halo by various events occurring in the galactic plane. The existence of such structures seems compatible with the galactic fountain and galactic convection ideas for the origin of halo gas discussed in Section 6.
2.2. Optical and Ultraviolet Absorption Line Studies
Recent optical and ultraviolet absorption line studies have provided important information about the distribution, abundances (see Section 4) and kinematics (see Section 5) of Milky Way halo gas. Many of the recent optical studies have produced interstellar line profiles with higher resolution and higher signal to noise than the ultraviolet studies. The optical data are therefore better suited for detailed studies of individual velocity components in the absorbing gas. Unfortunately, with the exception of TiII which has nearly the same ionization potential as HI, the species available to galactic optical observers are mostly trace ionization stages of elements of relatively low abundance (e.g. CaII, NaI and KI). In contrast, the ultraviolet observations, which have mostly been obtained with the International Ultraviolet Explorer (IUE) satellite, sample a wide range of ionization states of relatively abundant elements. Since the ultraviolet data of galactic halo gas provides the closest connection to the QSO absorption line literature those data will be emphasized in this discussion.
| Ion | n0 | H | Technique | Ref. |
| (cm-3) | (kpc) | |||
| HI | 0.1 | 0.8 | uv absorption | 1 |
| SiIV | 2 x 10⁻⁹ | 3 | uv absorption | 1 |
| CIV | 7 x 10⁻⁹ | 3 | uv absorption | 1 |
| NV | 3 x 10⁻⁹ | 2 | uv absorption | 1 |
| OVI | 3 x 10⁻⁸ | 0.3(+0.2,-0.15) | uv absorption | 2 |
| HI | 0.15 | 0.37 | uv absorption | 3 |
| SII | 8.4 x 10⁻⁷ | 0.32 | uv absorption | 3 |
| ZnII | 4.0 x 10⁻⁹ | 0.35 | uv absorption | 3 |
| SiII | 8.0 x 10⁻⁷ | 0.35 | uv absorption | 3 |
| MnII | 7.0 x 10⁻⁹ | 0.25 | uv absorption | 3 |
| FeII | 8.0 x 10⁻⁸ | 1.1 | uv absorption | 3 |
| CaII | 7.5 x 10⁻¹⁰ | 1.0 | optical absorption | 4 |
| HI | 0.0053 | 0.48 | 21 cm emission | 5 |
| HI | 0.09 | 0.25 | 21 cm emission | 5 |
| HI | 0.16 | 0.11 | 21 cm emission | 5 |
| e's | 0.03 | 0.8 | pulsar dispersion and | 6 |
| free-free absorption | 7 | |||
| e's | 0.6 | H emission | 8 | |
References: 1. Savage and Massa (1987); exponential scale heights derived from IUE data for 90 stars whose sight lines mostly sample interarm and intercloud gas. 2. Jenkins (1978); Copernicus OVI survey. Unfortunately only a few stars with |z| > 1 kpc were observed. The indicated scale height is very uncertain. 3. van Steenberg and Shull (1987b); Gaussian scale heights derived from IUE measurements of 261 stars. 4. Morton and Blades (1986); comparison measures of CaII with HI are not available although it may be possible to reconstruct the comparison from HI measures in the literature. 5. Lockman (1984); values listed represent fits of 3 components to the observed z distribution for galactocentric distances between 4 and 8 kpc. 6. Harding and Harding (1982), | ||||
The first survey of the optical CaII lines toward stars at high galactic latitudes by Munch (1956) and Munch and Zirin (1961) revealed that the mean number of intermediate and high velocity CaII components increased with z distance to the background star. From these observations it was concluded that interstellar clouds exist at z distances as large as about 1 kpc. These results motivated Spitzer's (1956) paper entitled On a Possible Interstellar Galactic Corona in which it was postulated that the neutral clouds found at large distances from the galactic plane require the pressure support of an exterior medium and this medium was most likely a hot gaseous corona. The pioneering observations of Munch and Zirin have been supplemented through important recent optical measurements of Albert (1983), Keenan et al. (1983), and Morton and Blades (1986). For a recent review of these and other optical results see Jenkins (1986).
The first studies in the ultraviolet with the IUE satellite of Milky Way halo gas involved measures of the interstellar absorption lines in the spectra of hot stars situated in the Large and Small Magellanic Cloud (Savage and deBoer 1979, 1981; Prevot et al. 1980; Gondhalekar et al. 1980). Other studies utilized Milky Way halo stars as background sources (Pettini and West 1982; deBoer and Savage 1983, 1984; Savage and Massa 1986, 1987). Extragalactic supernovae, the brightest QSOs and Seyfert galaxies have also been used as probes (Pettini et al. 1984; York et al. 1983, 1984). All these data reveal an absorbing gaseous region with a wide range of physical conditions. Because of the richness of the ultraviolet region of the spectrum the data are able to reveal absorption produced by a range of ionization states from CI to CIV, NI to NV, SiII to SiIV, etc.
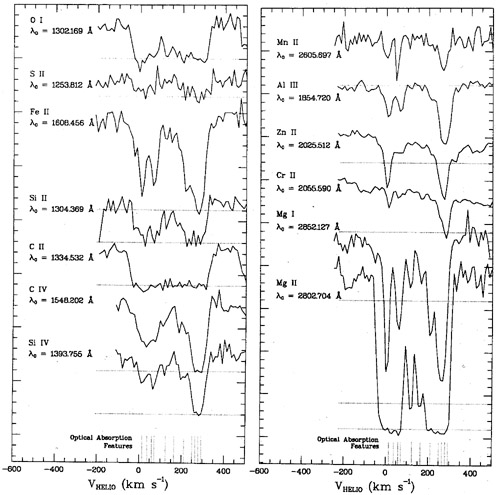
The occurrence of the brightest supernova in 384 years in the LMC has provided a new sight line to the LMC for which high quality ultraviolet and optical absorption line data are now available to probe Milky Way halo gas (deBoer et al. 1987; Dupree et al. 1987; Vidal-Madjar et al. 1987). Examples of these spectra are shown in Figures 3 and 4. The strong absorption extending away from zero LSR velocity in weakly and highly ionized features originates in Milky Way disk and halo gas. At high velocities (250 km s-1) absorption associated with the LMC is apparent.
|
Figure 3. Selected interstellar absorption lines in the ultraviolet spectrum of supernova 1987A. Intensity is plotted versus heliocentric velocity with the zero level of intensity indicated by the horizontal lines. The velocity of CaII absorption lines as determined from high quality optical spectra (see Figure 4) are marked on the velocity axis. The absorption extending away from 0 km s-1 is produced in the Milky Way. Absorption centered near 270 km s-1 occurs in the LMC. Absorption at the intermediate velocities of 60 and 120 km s-1 may be produced in the distant parts of the halo of the Milky Way, although Songaila et al. (1986) have proposed that these features are more likely associated with the LMC. In either case, these features may be representative of zero redshift absorption by gas in the outer parts of galaxies. The absorption between 0 and 100 km s-1 can be characterized as mixed ionization absorption with the strong low ionization lines of CII, SiII and MgII about three times stronger than the high ionization lines of CIV and SiIV. This IUE spectrum which has a resolution of 25 km s-1 is from Dupree et al. (1987). Similar examples of ultraviolet absorption toward the LMC are found in Savage and deBoer (1981) and deBoer et al. (1987). |
A subject of considerable controversy in recent years has been the possible origin of absorption at intermediate velocities toward the LMC. Songaila et al. (1986) have proposed an LMC and/or Magellanic Stream origin for this gas while Savage and deBoer (1979, 1981) attributed the absorption to the Milky Way. This absorption is apparent in most LMC star spectra near 60 and 120 km s-1 (Savage and deBoer 1981) and is associated with gas having HI column densities of about 2 - 5 x 10¹⁸ atoms cm-2 (McGee and Newton 1986). If this absorption is associated with the Milky Way and if the gas in the halo corotates with the gas in the disk, then the absorbing clouds would have z distances of -7 and -15 kpc, respectively (Savage and deBoer 1981). However, there is evidence that the corotation assumption is not valid for halo gas at |z| > 1 kpc. In fact, the rotational motion of high z gas seems to lag behind the rotation of the disk gas (see Section 5). For halo gas rotating more slowly than disk gas, the absorption line velocities for gas toward the LMC would imply clouds closer to the disk than the numbers given above.
|
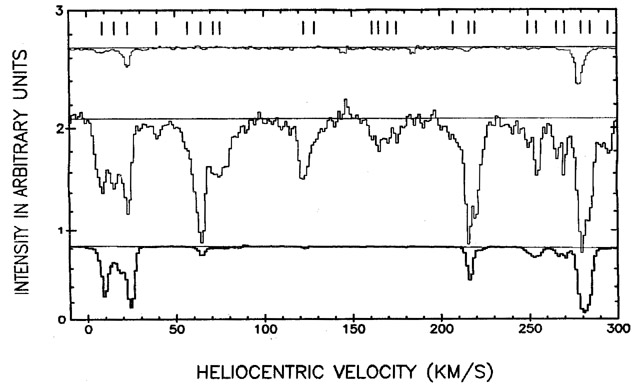
Figure 4. Optical interstellar absorption lines of KI, CaII and NaI in the spectrum of SN 1987A. At the top, tick marks show the locations of a `CaII forest' of 24 interstellar absorption components clearly detected in the H and K lines. A comparison of the CaII and NaI absorption in the components near 10 and 25 km s-1 versus that in the components near 65 and 125 km s-1 provides an excellent example of the effect first noted by Routly and Spitzer (1952) wherein the strength of the CaII absorption increases relative to that of NaI for clouds moving at intermediate and high velocities. The most likely explanation for this effect is the destruction of dust grains containing Ca in high velocity clouds either through shock processing of grains or through the processing of grains in the gas/dust environment which may have existed before the formation of the high velocity clouds. The data shown here were obtained at a resolution of about. 3 km s-1 which is approximately eight times better than for the IUE measurements of Figure 3. A comparison of this figure with Figure 3 shows that, at the lower re solution of the IUE data, multiple velocity components are severely blended. A curve of growth analysis that does not properly allow for this blending will likely produce very uncertain column densities. The data shown were obtained by Vidal-Madjar et al. (1987) using the high resolution instrumentation of the European Southern Observatory. |
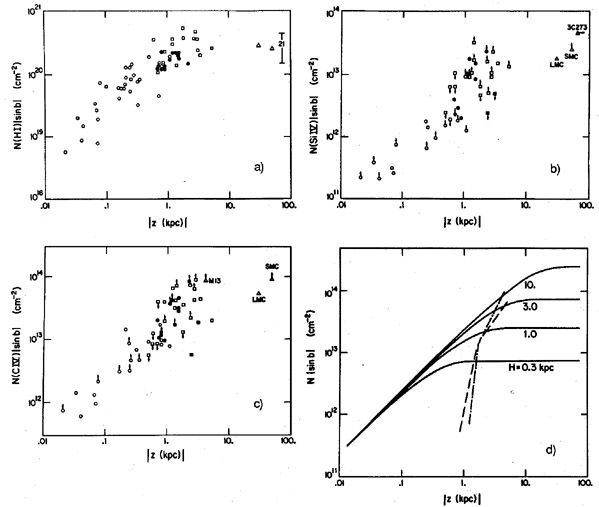
Because of the uncertainties of the motions of halo gas, it is unreliable at this time to use the observed velocities of the gas to estimate its distance. A better procedure for estimating the z extent of halo gas is to obtain measures of absorption toward stars at different z distances. With such data, the stratification of the gas away from the galactic plane can be established by examining at what z distance the measured column densities projected onto the z axis (N |sin b|) no longer increase. Measures of this type were obtained as part of the important halo gas survey of Pettini and West (1982). In that work it was concluded that the density distribution of SiIV and CIV peaked at a z distance of about 2 to 3 kpc. Savage and Massa (1985, 1987) have recently completed work on a new survey of SiIV, CIV and NV in galactic halo and disk gas. They report absorption line measurements toward 40 B stars at a wide variety of z distances. When these data are combined with the earlier Pettini and West (1982) data, the results shown in Figure 5 are obtained. In that figure N(ion)|sinb| is plotted against |z| for HI, SiIV and CIV. Figure 5d shows the expected behavior of N(ion)|sinb| versus |z| if the gas has a simple exponential distribution with scale heights of 0.3, 1.0, 3.0, and 10 kpc. The data for SiIV and CIV are roughly consistent with a scale height of 3 kpc while the HI data for the same star sample yields a smaller scale height of about 0.8 kpc (for a summary of scale height estimates see Table 2). The curves for SiIV and CIV show evidence for an enhancement in the density distribution of these ions over the simple exponential curve for z near 1 to 2 kpc. Such an enhancement is predicted by various models of photoionized halos (see Section 6 and Figure 5d).
|
Figure 5. These figures, which are based on
results from the IUE
satellite, provide estimates of the z extension of interstellar
HI, SiIV and CIV. In
(a), (b), and (c), N(ion)|sinb| for HI, SiIV and CIV is plotted against
|z(kpc)| for
approximately 60 stars located at various distances away from the
galactic plane. The figure is from
Savage and Massa
(1985)
and includes data for approximately 30 B
stars from their survey plotted as open and closed circles. The results
from the
Pettini and West
(1982)
halo gas survey are shown as squares. Extragalactic measurements from
Savage and deBoer
(1981) and
York et al. (1983)
are shown as triangles. In (d)
the solid lines illustrate the expected behavior of N(ion)|sinb| versus
|z| if the gas has
a simple exponential density distribution with scale heights of 0.3,
1.0, 3.0, and 10.0
kpc. These curves are most easily compared to the data by making a
transparency of
the figure and placing it over the data points. The data points for HI
in (a) are well
represented by an exponential distribution with a scale height of about
0.8 kpc. The
choice of the object sample has a significant effect on the appearance
of such plots. In
the case of the data shown above, the objects at small z are
mostly situated along sight
lines with relatively low gas densities, thus the inferred exponential
scale height for the
HI matches that generally associated with the component of HI that
extends to high z
(see Table 2). The data for the highly ionized
component of the gas can be compared
to the data for HI in order to compare the z extension of the
neutral and highly ionized
gas. In the case of the SiIV and CIV measurements of (b) and (c) the
inferred scale
heights of roughly 3 kpc are substantially greater than for the
HI. However, the latter
estimates are strongly influenced by the few extragalactic data points
(LMC,
SMC, and
3C273). The SiIV and CIV measurements suggest the
existence of an abrupt (factor of 2 to 3) increase near |z|
|
The work of Savage and Massa (1985, 1987) included sight lines extending over distances as large as 9 kpc through the low halo (|z| <2 kpc). Such measurements permitted the clear detection of NV absorption in halo gas for 10 lines of sight. NV is of great importance for the theories of halo gas because of the ions accessible to the IUE, it is the most difficult to create by photoionization (see Section 6). The data shown in Figure 6 also reveal that the character of halo gas in the inner galaxy (galactocentric distances between 4 and 6 kpc) is not substantially different than that of halo gas in the vicinity of the sun. This is interesting because there is a three fold enhancement in the number of HII regions and supernova remnants between the solar neighborhood and the inner galaxy.
An exceedingly important ion for studying hot galactic halo gas is OVI since oxygen is abundant and the conversion of OV to OVI requires 113 eV. In collisionally ionized gas OVI peaks in abundance near 3 x 10⁵ °K. Unfortunately, the information about OVI in the galactic halo is sparse because the OVI doublet near 1035 Å required the far ultraviolet capability of the Copernicus satellite which was unable to guide on stars fainter than about seventh magnitude and was limited to only a few of the brighter halo stars. From an OVI survey which included several stars with |z| ~ 1 kpc, Jenkins (1978) concluded that OVI has a scale height of 0.3 (+0.2,-0.15) kpc. However, this estimate is very uncertain.
A search for [FeX]  6375
absorption toward the LMC and several very distant
stars situated in the lower galactic halo by
Pettini and d'Odorico
(1986)
produced 3
6375
absorption toward the LMC and several very distant
stars situated in the lower galactic halo by
Pettini and d'Odorico
(1986)
produced 3 upper limits as low as 4 mÅ which corresponds to N(FeX)
 6 x
1016 cm-2. In the
most favorable case (HD156359) the upper limit to the column density of
106 °K gas
implied by these data exceeds by about 3000 times the column density of
gas at about
2 x 10⁵ °K detected through NV absorption. Since the
column density of 106 °K gas
which might produce [FeX] is expected to be about 50 to 150 times higher
than that
of the cooler phase, it would appear that another 10 to 20 times
increase in detection
sensitivity is probably needed to record FeX absorption toward a star
like HD156359.
6 x
1016 cm-2. In the
most favorable case (HD156359) the upper limit to the column density of
106 °K gas
implied by these data exceeds by about 3000 times the column density of
gas at about
2 x 10⁵ °K detected through NV absorption. Since the
column density of 106 °K gas
which might produce [FeX] is expected to be about 50 to 150 times higher
than that
of the cooler phase, it would appear that another 10 to 20 times
increase in detection
sensitivity is probably needed to record FeX absorption toward a star
like HD156359.
Although most of the attention has focused on the highly ionized gas in the halo as traced by SiIV, CIV and NV, the neutral and weakly ionized halo gas is actually about 10 times more abundant (Savage and deBoer 1981). The neutral and weakly ionized gas which is recorded in the ultraviolet spectra of the IUE satellite has been studied by van Steenberg and Shull (1987a, b) for a group of 261 stars. From these data, the estimates of the exponential scale heights of HI, SII, ZnII, MnII, SiII and FeII listed in Table 2 were obtained. The group of stars contains a large percentage which are situated in relatively dense regions of the galactic disk, thus the derived value of the HI scale height (0.37 kpc) from these measurements is smaller than for the data shown in Figure 5a (0.8 kpc). This difference illustrates how the nature of the object sample can influence the results of these scale height estimates. Thus, comparing HI scale heights with that of other ions for the same sample of stars is the most informative exercise. In such a comparison we see that based on the van Steenberg and Shull data the scale heights of SII, ZnII, SiII and MnII are roughly comparable to that for HI while the scale height for FeII (1.1 kpc) exceeds by a factor of about 3 that of HI. For SII, ZnII, MnII, SiII and FeII, the ionization stage listed is the dominant ionization state of the element in the neutral interstellar gas. The more extended z distribution for FeII compared to other heavy elements was recognized in an earlier analysis of IUE data by Jenkins (1983).
A large scale height of 1.0 kpc has also been found for CaII based on
the optical absorption line data of
Morton and Blades
(1986)
who included results from
Hobbs (1974),
Albert (1983) and
Keenan et al.
(1983).
In the case of this result, the scale
height comparison with HI was not available although it might be possible to
construct such a comparison using the extensive HI
Ly- survey results of
Shull and van
Steenberg (1985) or
Bohlin, Savage and
Drake (1978).
In the interstellar gas of the galactic disk which contains dust, elements are often depleted by large factors and the amount of depletion increases with line of sight density (for a recent review see Jenkins 1987). For < nH > = 3 atoms cm-3, Zn, Si, Mn, Fe and Ca are depleted by factors of 3, 40, 20, 100, 4000, respectively (see Figure 5 in Jenkins 1987) while for < nH > = 0.03 cm-3 the depletions are factors of 2, 4, 6, 16 and 16. It is noteworthy that the two elements with the greatest depletion (Fe and Ca) are the ones having scale heights for the neutral gas phase which greatly exceed the HI scale height. A plausible explanation for this result is that the gas to dust ratio increases with |z| and the effect is most easily recognized in data for the most highly depleted species. A shift in the gas to dust ratio with |z| could be caused by a dust destruction processes which preferentially destroys dust in low density environments or by a halo injection process which primarily injects matter containing a greater gas to dust ratio than is found in the matter of the galactic disk. However, the selective production of gaseous Fe by Type I supernovae occurring in the galactic halo is an alternate possibility which can not be ruled out (see Jenkins 1983, 1986; van Steenberg and Shull 1987a, b).
Hot plasmas emit X-ray continuum and line radiation. The continuum is from Bremsstrahlung, radiative recombination and two photon emission from one and two electron atoms. The line emission is from collisionally excited lines and recombination followed by radiative cascades. Various broad band X-ray instruments have been used to study the diffuse X-ray background from the interstellar medium. For example, the Wisconsin soft X-ray measurements of McCammon et al. (1983) and Bloch et al. (1986) employ detectors with the bands: Be(0.078-0.111 keV), B(0.130-1.88 keV), C(0.160-0.284 keV) and M1(0.440-0.930 keV). The interpretation of the data requires a good understanding of the geometry of the hot emitting gas and the cooler absorbing gas. To reach optical depth one in the absorbing medium requires larger column densities as the X-ray band energy increases, For the Be, B, C and M1 bands listed above an X-ray absorption optical depth of one is obtained for hydrogen column densities of 1 x 10¹⁹, 6 x 10¹⁹, 1.1 x 10²⁰ and 1.1 x 10²¹ atoms cm-2 .
The relatively small absorption mean free path for Be and B band X-rays implies that emission observed in these bands must arise from relatively nearby gas (i.e. r < 100 pc; Bloch et al. 1986). For the higher energy bands the situation is less clear and has been the subject of a debate which has extended over more than a decade. Several groups have claimed the detection of X-rays from Milky Way halo gas while other groups working with similar data advocate a local origin for the X-rays. The data which have been cited as favoring the detection of a hot halo component are the MI band (0.5 to 1.0 keV) data of Nousek et al. (1982) and the SAS-3 C band data of Marshall and Clark (1984). In both cases the measurements are compatible with the existence of hot halo gas with an emission measure perpendicular to the galactic plane of about 0.004 cm-6 pc and a temperature of about 2-3 x 10⁶ °K. If the X-ray emitting gas has a z extension of about 3 kpc which is the value inferred from the IUE measures of CIV and NV, its density would be about 10-3 cm-3. However, the X-ray data are also compatible with a more local origin for the emission.
2.4. Optical and Ultraviolet Emission Line Studies
Observations of faint optical emission lines from the diffuse
interstellar medium
can be used to study the warm ionized gas of the Milky Way disk and
halo. Studies of
H relating to gas at high
z distances have been reviewed by
Reynolds (1986).
Faint
H emission from high |z|
gas in the Perseus spiral arm can be traced to 20 degrees
away from the galactic plane which implies the detection of ionized gas
at |z|  1
kpc. The scale height estimated for this ionized gas is about 0.6
kpc. An independent
estimate of the ionized gas scale height can be obtained from the
variation in the
H intensity distribution from
the galactic pole to the galactic plane. The result is
also 0.6 kpc. The H intensity
at high galactic latitudes implies that toward the
galactic pole the emission measure of the warm ionized gas is
1
kpc. The scale height estimated for this ionized gas is about 0.6
kpc. An independent
estimate of the ionized gas scale height can be obtained from the
variation in the
H intensity distribution from
the galactic pole to the galactic plane. The result is
also 0.6 kpc. The H intensity
at high galactic latitudes implies that toward the
galactic pole the emission measure of the warm ionized gas is
 n2e dx = 2 cm-6
pc. When this number is compared with the electron column densities
(from pulsar
dispersion measures) inferred for gas located in the direction of the
galactic pole, i.e.
ne dx = 8 x 1019 cm-2 (see
Section 2.5), it is possible to evaluate the amount
of clumping
of the ionized gas. The result is a volume filling factor of about 0.2
for gas parcels having an electron density of about 0.2 cm-3.
n2e dx = 2 cm-6
pc. When this number is compared with the electron column densities
(from pulsar
dispersion measures) inferred for gas located in the direction of the
galactic pole, i.e.
ne dx = 8 x 1019 cm-2 (see
Section 2.5), it is possible to evaluate the amount
of clumping
of the ionized gas. The result is a volume filling factor of about 0.2
for gas parcels having an electron density of about 0.2 cm-3.
A very important recent discovery is the definite detection of
ultraviolet emission
from CIV 1550 and OIII]
1663 in several directions at
high galactic latitude by
Martin and Bowyer
(1987).
These data appear to convincingly establish that the
origin of much of the CIV found in Milky Way halo gas is through
processes occurring
in hot collisionally ionized gas near 105 °K rather than
in warm (104 °K) photoionized
gas (see Section 6). This result is compatible with
the direct detection of NV absorption in galactic halo gas by
Savage and Massa
(1985).
These ultraviolet results suggest that
very interesting information about 105 °K gas in the
halo might be obtained from
ground based studies of emission from diffuse [OIII]
5007.
2.5. Radio Studies of the Ionized Gas
A number of radio astronomical techniques have provided information about the
ionized gas of the low halo (i.e. |z| < 1 kpc). These include
pulsar dispersion measures
which yield values of
ne dx to a large number of
pulsars (see
Harding and Harding
1982)
and free-free absorption measures toward extragalactic radio sources which
provide
n2e dx to the edge of the galaxy
[Spitzer (1978)
reviews these and other radio
measurements of the ionized gas]. The radio measurements are compatible
with the
existence of a diffuse but patchy layer of ionized gas with an
exponential scale height
of about 0.8 kpc, an average mid-plane density < ne > =
0.03 cm-3, an average
mid-plane square density < n2e > = 0.009
cm-6, and a column density to the galactic pole
of
ne dx = 8 x 10¹⁹ electrons
cm-2. The 21 cm emission line studies and the
Ly-
absorption studies toward the galactic pole yield neutral hydrogen
column densities
averaging about 2.5 x 10²⁰ atoms cm-2. Thus about
25% of the gas in the direction of the galactic poles is ionized.
2.6. Nonthermal Radio Emission, Magnetic Fields and the Cosmic-Ray Halo
A full understanding of the physical nature of the gaseous galactic halo must consider the inter-relationships among the thermal gas phases, the magnetic field and the cosmic-rays. The magnetic field and cosmic-rays may have a role in supporting the thermal gas at the large z distances it is found. Through its pressure the magnetic field may influence the motions of halo gas. The field also provides a way of propagating waves into the halo which might dissipate and heat the gas (Hartquist 1983). The scale heights of the galactic magnetic field and cosmic rays are uncertain but the existing data all point toward relatively large scale heights (> 1 kpc).
Observations of cosmic-ray radio-active isotopes with long half-lives
such as 10Be
(Garcia-Munoz,
Simpson, and Wefel 1981;
Guzik et al.
1985)
imply that the cosmic-rays
spend much of their life moving in galactic regions of relatively low
gas density
and that they therefore probably spend a significant portion of their
lives at large
distances away from the galactic plane. Studies of the non-thermal
radiation from
the Milky Way provide information about cosmic ray electrons interacting
with the
galactic magnetic field. The non-thermal radiation is estimated to have
a half intensity z extension which ranges from 1 to 3 kpc
(Beuermann, Kanbach and Berkhuijsen 1985
and references therein). However, it is difficult to separately derive
from such data
the cosmic ray scale height and the magnetic field scale height. The
results for the
 -ray emission
which might be attributed to Compton interactions between a cosmic
ray electron halo and various background photon fields also suggest a
thickness of the high energy electron halo of about 3 kpc
(Stecker 1979).
-ray emission
which might be attributed to Compton interactions between a cosmic
ray electron halo and various background photon fields also suggest a
thickness of the high energy electron halo of about 3 kpc
(Stecker 1979).
Information about magnetic fields at large z distances follows from a statistical comparison of the Faraday rotation measures of extragalactic radio sources and pulsars. The extragalactic sources show a substantial excess of rotation measure compared to the pulsars. Since the pulsars are mostly situated at |z| < 0.5 kpc the excess can be attributed to contributions from electrons located in magnetic fields at |z| > 0.5 kpc (Sofue et al. 1979; Sofue, Fujimoto and Wielebinski 1986). However, such a comparison will be influenced by a component of Faraday rotation which is associated with the extragalactic source.
 , and R) is
illustrated for R = 17 kpc. Near
, and R) is
illustrated for R = 17 kpc. Near
 (R > 10 kpc) =
250 km s-1 was assumed. The galactic warp which extends
from about +1 kpc to about -1 kpc is clearly seen. While the faintest
contours are
very uncertain because antenna side lobe contamination was ignored in
the analysis,
the data do suggest a very large z extension for the HI in the outer
galaxy. For
example, at
(R > 10 kpc) =
250 km s-1 was assumed. The galactic warp which extends
from about +1 kpc to about -1 kpc is clearly seen. While the faintest
contours are
very uncertain because antenna side lobe contamination was ignored in
the analysis,
the data do suggest a very large z extension for the HI in the outer
galaxy. For
example, at