

Figure 1 gives an overview of information on
background radiation
in the Universe. The reason to plot
 I is so that it is
possible
to read off the relative contributions to total energy density.
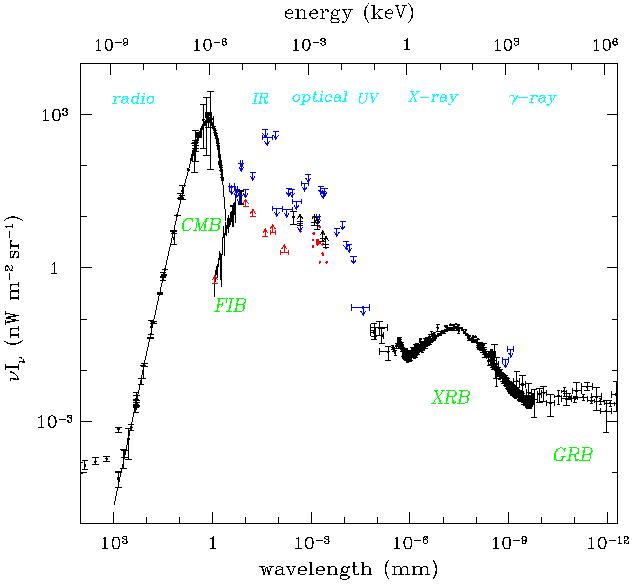
What can be seen is that the Cosmic Microwave Background (CMB) is by far
the dominant background. The CMB corresponds to an energy density of
0.260 eV cm-3, or a number density of 410 cm-3,
corresponding to about 2 billion photons per baryon in the Universe
today. On the figure, the next biggest background
- almost two orders of magnitude
down in energy contribution - is in the far-IR/sub-mm part of the
spectrum, and believed to come from distant, dusty, star-forming galaxies.
A little below that is the near-IR/optical background, coming from the sum
of the emission of all the stars in all the galaxies we can observe. Then
much lower are the X-ray and
I is so that it is
possible
to read off the relative contributions to total energy density.
What can be seen is that the Cosmic Microwave Background (CMB) is by far
the dominant background. The CMB corresponds to an energy density of
0.260 eV cm-3, or a number density of 410 cm-3,
corresponding to about 2 billion photons per baryon in the Universe
today. On the figure, the next biggest background
- almost two orders of magnitude
down in energy contribution - is in the far-IR/sub-mm part of the
spectrum, and believed to come from distant, dusty, star-forming galaxies.
A little below that is the near-IR/optical background, coming from the sum
of the emission of all the stars in all the galaxies we can observe. Then
much lower are the X-ray and
 -ray backgrounds,
which come predominantly from active galactic nuclei.
-ray backgrounds,
which come predominantly from active galactic nuclei.
|
Figure 1. A compilation of recent
constraints on extragalactic diffuse
background radiation. In terms of total energy the CMB dominates, with the
Far-Infrared and Optical Backgrounds about a factor of 100 lower.
These data are based upon the older compilation of primarily from Ressell &
Turner 1990
[1],
supplemented with more recent data from:
Smoot 1997 [2]
for the CMB; Lagache et al. 1999
[3] and
Hauser et al. 1998
[4]
for the FIB; Leinert et al. 1998
[5]
for a near-IR to near-UV compilation; Dwek & Arendt 1998
[6]
for the near-IR; Pozzetti et al. 1998
[7] for the optical;
Miyaji et al. 1998
[8]
and Gendreau et al. 1995
[9]
for the X-ray; and Sreekumar et al. 1998
[10],
Kappadath et al. 1999
[11]
and Watanabe [12]
for the |
Apart from the CMB, there is no evidence for background emission arising from anything other than known sources of radiation: stars, gas and dust within galaxies. In other words, there is no reason to believe that decaying particles, for example, distributed throughout the Universe, are contributing much to the background, and hence these sorts of data can place constraints on exotic particles (e.g. [1]). The CMB is different, however. Its spectral shape is spectacularly well-fit by a blackbody [13, 14, 2], over more than 4 decades in frequency. The current best estimate of the CMB temperature is
[15].
The fact that the CMB is such a good blackbody is one of the
pillars of the standard Big Bang model. The argument is
that, since we can't even make such a good blackbody in the lab, the CMB
needs to have originated from something in extraordinarily good thermal
equilibrium. The only known source is the entire Universe, during an
earlier epoch when it was very much hotter and denser. Together with
the Hubble law for distant galaxies, this leads to a robust model
in which the Universe used to be hot and dense, and has been cooling and
expanding since then.
Since we know that the Universe consists mainly
of hydrogen, we can calculate (see
[16] for a recent
update) that the Universe was ionized
when it was hotter than about 4,000K (a lower temperature than you
might have first guessed, because of the high photon-to-baryon ratio). Since
the radiation redshifts just like T
Although all measurements are currently only upper limits, there is
some prospect of detections of spectral distortions from planned spectral
experiments [18].
For example,
at low frequencies it seems feasible to detect Bremsstrahlung emission from
the reionized gas in the inter-galactic medium at moderate redshifts
[19].
However, progress in constraining other realistic physical effects
will require considerably greater improvements in experimental sensitivity.
As well as distortions to the spectrum, the CMB also contains cosmological
information in the variations in temperature across the sky
[20].
After the detection of CMB anisotropy by the COBE satellite in
1992 [21]
attention has been focussed almost exclusively on these
anisotropies. This is partly because it became clear that detection
was easily within reach of state-of-the-art detectors, but also because
theoretical calculation showed that precise measurements of the anisotropy
power spectrum would provide detailed information about fundamental
cosmological parameters
[22].
Figure 2. Most of the experiments published
to date. See Smoot & Scott
(1997) [17]
for full references, supplemented with more recent
results from: OVRO Ring
[25], QMAP
[26], MAT TOCO
[27],
CAT [28],
Python V [29]
and Viper
[30]. The error
bars (these are 1
Since COBE
there have been around 20 separate experiments which have detected
temperature fluctuations which are most likely to be primordial. These
are summarized in Figure 2.
Here the x-axis is the spherical harmonic multipole,
l. The temperature
fluctuation field on the sky can be decomposed into an orthogonal set of
modes:
Since there is no preferred direction on the sky
(e.g. [23])
the individual ms are irrelevant, and so the
important information is contained in the power spectrum
Indeed if the perturbations are Gaussian, then this contains all the
information.
The conventional amplitude of the quadrupole is given as
A `flat' spectrum means one in which
l(l + 1) Cl = constant, and we can
therefore define that
constant in terms of the expectation value for the
equivalent quadrupole Qflat - which
is what is plotted as the y-axis in Figure 2.
Each experiment quotes one
(or in the best cases several) measures of power over a range of multipoles,
and these can be quoted as `band powers' or equivalent amplitudes of a flat
power spectrum through some `window function'. The horizontal bars on the
points are an indication of the widths of these window functions.
 (1 + z), then
that means the
Universe recombined (1)
at z
(1 + z), then
that means the
Universe recombined (1)
at z  1500. This was the
time when
the radiation last interacted with the matter (through electron scattering),
and most CMB photons have been travelling freely since then. In models
with typical parameters, this epoch corresponds to a time of around
300,000 years.
The spectrum is thermalised (by double Compton and Bremsstrahlung) for
times earlier than about 1 year, corresponding to z ~ 107.
Hence particle decays, or other energy emitting processes, occurring over
the redshift range 103 < z < 107,
could leave an observable signature on the
CMB spectrum (see e.g.
[17]).
1500. This was the
time when
the radiation last interacted with the matter (through electron scattering),
and most CMB photons have been travelling freely since then. In models
with typical parameters, this epoch corresponds to a time of around
300,000 years.
The spectrum is thermalised (by double Compton and Bremsstrahlung) for
times earlier than about 1 year, corresponding to z ~ 107.
Hence particle decays, or other energy emitting processes, occurring over
the redshift range 103 < z < 107,
could leave an observable signature on the
CMB spectrum (see e.g.
[17]).
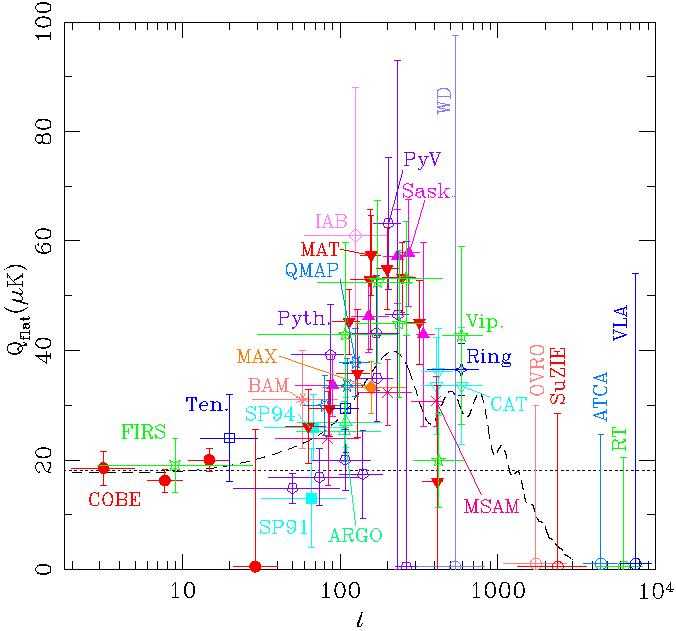
 except for
the upper limits which are 95%)
have generally been symmetrised for clarity, and calibration
uncertainties are included in most cases. The horizontal bars represent
the widths of the experimental window functions. The dotted line is the
flat power spectrum which best fits the COBE data alone. The dashed
curve is the prediction from the vanilla-flavoured
standard Cold Dark Matter model.
except for
the upper limits which are 95%)
have generally been symmetrised for clarity, and calibration
uncertainties are included in most cases. The horizontal bars represent
the widths of the experimental window functions. The dotted line is the
flat power spectrum which best fits the COBE data alone. The dashed
curve is the prediction from the vanilla-flavoured
standard Cold Dark Matter model.
1 This process is always called
recombination, even although in the cosmological context the atoms
begin by being uncombined, and hence the process is really
combination. For particle physicists who feel the corners of their mouths
lifting here, let me point out that this is not too dissimilar to the talk
of symmetry restoration in the early Universe, which only makes literal
sense if time runs backwards. Back.