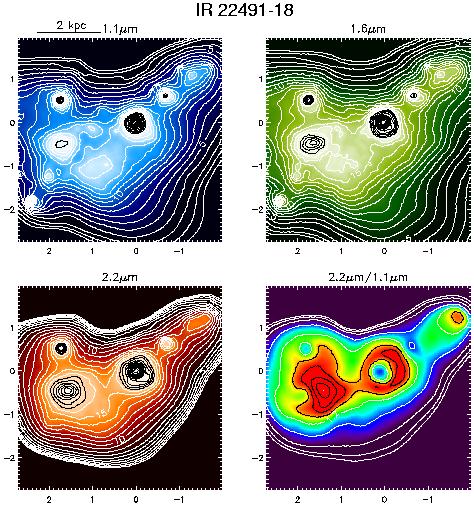
This spectacular system has two nuclei separated by
1.6" (2.4 kpc), which were first observed by Carico et al. (1990b).
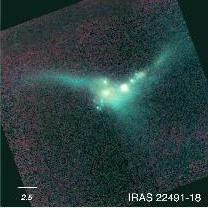
Many extremely luminous clusters and two high surface brightness
tidal tails are seen extending to E and NW. The western nucleus is
unresolved in all three bands. Optical imaging reveals so many luminous
star clusters as to prevent identification of the actual nuclei;
near-infrared data are required to locate them (Surace 1998, Surace et al.
1999b). The optical images also reveal that the full extent of the tails,
which terminate in complex loops. Many of the clusters seen by NICMOS are
embedded in these tails, particularly the one to the NW.
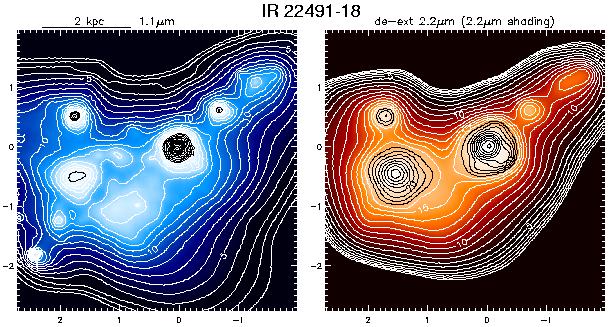
Shaded contour plots of the extinction corrected
2.2 µm emission are shown together with the 1.1
µm (upper left)
observed emission. In both panels, the contours and shading are
logarithmic with the contours spaced by factors 21/2. (The level
values are the same as for the figure above). The arcsec displacements
in RA and DEC, given along the borders are measured from the 2.2
µm in
all frames. At the upper left, a length bar is drawn. For the ratio image,
both the 2.2 and 1.1 µm images were smoothed with the same adaptive
smoothing and then smoothed with a Gaussian FWHM = 0.2" in
calculating the 2.2 µm opacity from Eq. 3 (see text). In
cases where a
strong point-source or variable background contaminated the 2.2 µm
image, the extinction corrected image was derived for 1.6
µm. For the
galaxies with strong point-sources, the PSF was fit to the source and then
subtracted and replaced by a Gaussian with the proper integrated flux (see
text - NGC 7469, IRAS 08572+3915, IRAS 05189-2524, PKS 1345+12, IRAS 07598+6508, Mrk 1014 and 3C48).