


The total flux from resolved sources defines a lower limit to the EBL. Typically, such minima are obtained by measuring the flux in individual resolved sources using standard photometry packages, such as FOCAS (Valdes 1982, Jarvis & Tyson 1981) or SExtractor (Bertin & Arnouts 1996), and summing the flux in the resulting catalog of objects (c.f. Tyson et al. 1989, Madau et al. 1996, 1998). While it is quite straightforward to measure an isophotal magnitude, it is very difficult, if not impossible, to measure the total flux of an object including that flux in regions fainter than the noise level of the local sky. Efforts at measuring galaxy counts often attempt some sort of "total magnitude" correction, either by scaling the isophotal aperture to include roughly twice the isophotal extent (see Bertin et al. 1998 for discussion) or by applying a magnitude correction to galaxies near the detection limit (c.f. Smail et al. 1995).
Fortunately, individual source photometry is not necessary for
estimating a lower limit to the EBL in our data. We have developed a
simplified method of aperture photometry with which we can measure the
flux from the ensemble galaxy population as a whole. We first use
SExtractor to identify detectable sources and their isophotal radii
(riso) using detection and extraction parameters very
similar to those employed in
Williams et al. (1996)
(see Section 4.4).
We can then measure the "sky" surface brightness,
µsky,
for an image by masking all detected sources (V555
 27.5 A B mag) and
computing the average surface brightness of the
remaining pixels. In doing so, we implicitly assume that
extragalactic sources fainter than this limit contribute negligibly to
the EBL, so that the apparent background level in the image consists
only of foreground sources. (4)
To estimate the total surface brightness from extragalactic sources and
foregrounds, µobj+sky, we mask all stars and
only galaxies brighter than Vcut = 23 A B mag and
again compute the average
surface brightness of the remaining pixels. We then isolate the flux
from resolved sources, the minimum value of EBL23, by differencing the
two surface brightness estimates: minEBL23
27.5 A B mag) and
computing the average surface brightness of the
remaining pixels. In doing so, we implicitly assume that
extragalactic sources fainter than this limit contribute negligibly to
the EBL, so that the apparent background level in the image consists
only of foreground sources. (4)
To estimate the total surface brightness from extragalactic sources and
foregrounds, µobj+sky, we mask all stars and
only galaxies brighter than Vcut = 23 A B mag and
again compute the average
surface brightness of the remaining pixels. We then isolate the flux
from resolved sources, the minimum value of EBL23, by differencing the
two surface brightness estimates: minEBL23
 µobj = ԁobj+sky -
µsky. In contrast to standard aperture photometry,
ԁobj+sky will always include all of the light
from faint galaxies. However µsky can include
galaxy flux if the masks are too small.
µobj = ԁobj+sky -
µsky. In contrast to standard aperture photometry,
ԁobj+sky will always include all of the light
from faint galaxies. However µsky can include
galaxy flux if the masks are too small.
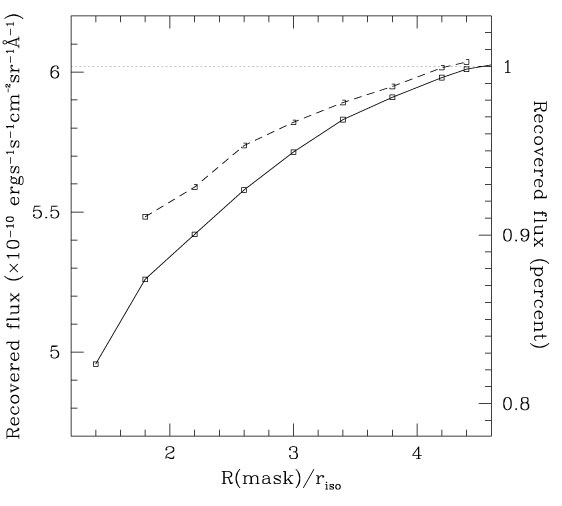
Not surprisingly, minEBL23 from this method of ensemble photometry
is a strong function of the mask size. The growth curve plotted in
Figure 18 shows that at least 20% of the flux
from galaxies within 4.5 magnitudes of the detection limit
(23 < V < 27.5 A B mag) lies beyond
 2 ×
riso for individual galaxies. As discussed in
Williams et al.
(1996),
it is possible for the faintest galaxies detected to have isophotal radii
which are smaller than the WFPC2 90% encircled energy radius for a
point source (0.3 arcsec, or 3 pixels). To explore the effect of this
resolution limit, we also show in Figure 18 the
growth curve which results if we impose 0.3 arcsec as a minimum for
riso and increase the mask size relative to that new
starting
radius. Naturally, the improvement in recovered flux is significant:
in the HDF catalog of Williams et al. , nearly all galaxies with
V606 > 27.5 A B mag are affected by this size
requirement. While the
instrumental PSF clearly contributes to the increasing recovered flux
with radius, the growth curve is not entirely due to PSF effects:
the 100% encircled energy radius would be reached by a mask of radius
2.5riso if the smallest galaxies were physically
contained within the original isophotal radii.
2 ×
riso for individual galaxies. As discussed in
Williams et al.
(1996),
it is possible for the faintest galaxies detected to have isophotal radii
which are smaller than the WFPC2 90% encircled energy radius for a
point source (0.3 arcsec, or 3 pixels). To explore the effect of this
resolution limit, we also show in Figure 18 the
growth curve which results if we impose 0.3 arcsec as a minimum for
riso and increase the mask size relative to that new
starting
radius. Naturally, the improvement in recovered flux is significant:
in the HDF catalog of Williams et al. , nearly all galaxies with
V606 > 27.5 A B mag are affected by this size
requirement. While the
instrumental PSF clearly contributes to the increasing recovered flux
with radius, the growth curve is not entirely due to PSF effects:
the 100% encircled energy radius would be reached by a mask of radius
2.5riso if the smallest galaxies were physically
contained within the original isophotal radii.
|
Figure 18. The ensemble flux recovered from apertures around detected galaxies (V > 23 A B mag) as a function of the radius of the apertures. Radius is given in terms of the limiting isophotal radius (riso) for each galaxy. The solid line shows the flux recovered when riso is unconstrained; for the faintest objects, riso may be less than 3 pixels (the 90% encircled energy radius of WFPC2). The dotted line shows the flux recovered when a 3 pixel minimum is imposed for riso. Note that the curve has not yet converged at the limit of the mask size plotted here. |
In addition to the fact that apertures extending to twice each galaxy's isophotal area will not recover all of the galaxy light from detected galaxies, the "local sky" estimates used in standard photometry packages come from regions just beyond the apertures for each source. These sky estimates will undoubtedly include a significant fraction of this missed light, doubly compounding the photometry errors.
While the growth curve in Figure 18 is beginning to level off by 4riso, it is clearly not flat. The covering factor of galaxies to 4riso is roughly 20% in these images, and roughly 30% of the galaxies defined by these apertures overlap. In the HDF images, more than 1800 galaxies are found beyond our detection limit, with a covering factor of roughly 80% to 4riso. These facts suggest that we have reached a confusion limit of sorts, in the sense that the wings of detectable galaxies are overlapping. Moreover, these facts suggest that the wings of detectable galaxies contribute flux to a significant fraction of the pixels used to measure the foreground "sky" level, producing an extragalactic "pedestal" level which blends with the diffuse flux from ZL and DGL. Even though the flux level of our growth curve in Figure 18 is clearly converging, it cannot be used to quantify this pedestal of overlapping galaxy wings.
To estimate the flux contained in the wings of galaxies beyond 4riso in our own images, we have constructed a Monte Carlo simulation of the contribution to a random point on the sky from randomly distributed, detectable galaxies. The surface number density of detectable galaxies was drawn from the published HDF catalog and exponential light profiles were adopted for all galaxies, with scale lengths and central surface brightness matching the galaxies in the EBL and HDF images. Efforts to characterize the light profiles of faint galaxies have produced evidence for both exponential disks and flatter, irregular profiles (for example, see Smail et al. 1995, Driver et al. 1995, Brinchmann et al. 1998, Driver et al. 1998 and references therein). For the faintest galaxies, profiles are unconstrained. We adopted exponential profiles here, in part because they produce the most conservative (smallest) estimate of the light beyond the 4riso apertures. Also, given that the physical scales at those radii are large, we expect to be beyond any central bulges. We also note that the additional flux identified by our models from the faintest galaxies is less than 10% of the flux in galaxy counts by standard methods, and so is the adopted profiles for the faintest galaxies are not a critical issue to the minimum EBL estimates. The simulations are described in Appendix B. For the F555W EBL images, we estimate that the additional flux from galaxies beyond 4riso is roughly 1.1 × 10⁻¹⁰ ergs s-1 cm-2 sr-1 Å-1. The simulations are affected only by the surface brightness limits, galaxy profiles, and the galaxy surface densities adopted. Similar levels are therefore found for the F814W images, for which galaxy parameters and detection limits are very similar to those at F555W. The F555W aperture masks have been used to recover the flux from sources in all three bands for reasons discussed below. In the very low signal-to-noise ratio F300W images, only 20% of the F555W sources are detected, and the F555W aperture masks for those which are detected extend to many more than four times the F300W isophotal detection areas. Due to the larger statistical uncertainties in the flux recovered by ensemble photometry at F300W (see Table 10), simulations of the flux beyond the detection apertures were not warranted.
By using different values for Vcut (23, 24, 25 and 26 AB
mag), we can isolate the flux contributed from galaxies in successive
magnitude bins. Comparing these measurements with the integrated flux
from standard photometry methods (see
Section 4.4), we find
that roughly 15%, 25%, 45% and 65% of the total flux in successive
1 magnitude bins between 23 < V555 < 27 is
contained at radii between
2 riso
and 4riso. In our data, galaxies with
magnitudes 23 < V555 < 27.5 have
1.5 <  µ < 3.5 mag
arcsec-2 as shown in Figure 19. These
measurements are in broad agreement with the models in the literature
for the fraction of flux which can be recovered as a function of
µ
based on extrapolation of simple exponential profiles
(c.f.
Disney & Phillipps 1983,
Davis 1990,
Dalcanton 1998).
µ < 3.5 mag
arcsec-2 as shown in Figure 19. These
measurements are in broad agreement with the models in the literature
for the fraction of flux which can be recovered as a function of
µ
based on extrapolation of simple exponential profiles
(c.f.
Disney & Phillipps 1983,
Davis 1990,
Dalcanton 1998).

|
Figure 19. Isophotal surface brightness,
µiso,
versus core surface brightness (mean surface brightness in the
brightest 4 pixels), µcore, for all detected
galaxies in the EBL images in unit magnitude bins 22 <
V555 < 28; the faintest
bin with data shows 27 < V < 28. In each plot, the
diagonal lines (right) mark the limit µiso =
µcore; the horizontal
lines (left) show the mean µiso, defined by sky
noise (1 |
The total flux in resolved galaxies as measured by ensemble photometry has two obvious implications for galaxy counts. First, the total flux in galaxy counts based on standard photometry will significantly underestimate the EBL. This point is discussed further in the following sections. Second, because standard photometry will miss fractionally more light from the faintest galaxies, the galaxy counts which result will have an artificially shallow slope at the faint end. Our results allow us to derive "aperture corrections" for faint galaxy photometry as a function of central and isophotal surface brightness. This is done in Paper III. We can use these corrections to recalculate the surface number density of galaxies as a function of magnitude. As we discuss in detail in Paper III, the corrected number counts do not flatten out at the faintest limits of the HDF.
4 We point this out not because we believe that the flux in galaxies beyond the detection limit is negligible, but rather as a reminder that the sum in detected galaxies is by definition a minimum value for the detected EBL. Back.
 sky).
As expected, this does not change with magnitude. The distribution in
µcore narrows at fainter
apparent magnitudes, suggesting that
surface brightness biases and detection limits may be causing
incompleteness at the fainter magnitudes. The detection limit occurs
at V = 27.5 AB mag, at which the average galaxy has
µiso - µcore ~ 1.5 mag
arcsec-2. The requirement for detection in our data is
µcore <
2
sky).
As expected, this does not change with magnitude. The distribution in
µcore narrows at fainter
apparent magnitudes, suggesting that
surface brightness biases and detection limits may be causing
incompleteness at the fainter magnitudes. The detection limit occurs
at V = 27.5 AB mag, at which the average galaxy has
µiso - µcore ~ 1.5 mag
arcsec-2. The requirement for detection in our data is
µcore <
2