


The varied means of segregating mass from light described in the previous section have fairly clear-cut observational consequences. Firstly, any segregation process will, by definition, produce a mass-to-light ratio which varies over those scales on which the process operates. Dynamical mass estimates should be sensitive to this variation. Secondly, unless one invokes either prerecombination segregation of non-baryonic dark matter from isothermal baryon lumps, or very large scale explosive galaxy formation in a non-baryon dominated universe, biased galaxy formation is the only process which can provide segregation on scales larger than a few megaparsecs. And biased galaxy formation is very likely to produce observable variations with environment in the properties of the galaxy population.
In principle, measurements of the luminosity and mass densities on a wide range of length scales can provide a complete and unambiguous answer to the question of the relative clustering of light and mass. In practice, one may not be able to determine the mass reliably on some scales without knowing the degree of relative clustering of the two components ahead of time. In that case, as we shall see, we must rely on arguments of consistency and simplicity to reach the most probable truth.
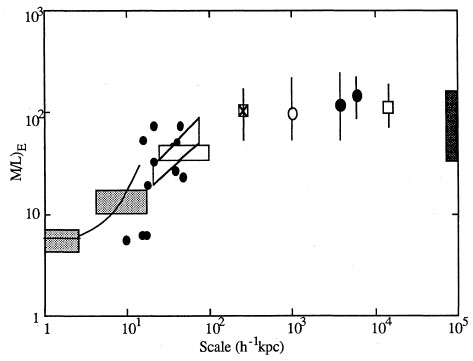
In Figure 2 I shall summarize the mass-to-light ratios obtained by the methods to be discussed below. Most derived values of M/L depend on the assumed value of H0. Also, because the luminosity per unit stellar mass depends on the stellar population, which varies with Hubble type, mean values of M/L for populations of galaxies vary with the mix of morphological types in the population. Both theoretical calculations and the observed dynamics of binary galaxies suggest that the mass-to-light ratio of a population of E/SO's is about twice that of a typical spiral dominated population. Finally, because the ratio of mass to light is quoted in solar units, and the colors of galaxies are different than that of the sun, M/L, measured in solar units, depends on the photometric band. The papers quoted below have assumed various values of H0, various photometric bands, and refer to different groups of galaxies. To minimize confusion, and put all values of M/L on a common scale, I have converted all quoted values to those appropriate for H0 = 50 km s-1 Mpc-1, for the V band, and for a population of elliptical and SO galaxies. The reader is cautioned, therefore, that the values of M/L)E that I cite may be different than the values in the original papers. The length scales in Fig. 2 are quoted in units of h-1 Mpc.
|
Figure 2. Mass-to-light ratios of early-type galaxies, derived from various dynamical systems, versus the size of the system. |
By far the most reliable mass estimates are those obtained from the rotation curves of disk galaxies. The undisturbed disks of moderate and high luminosity galaxies are in circular orbit in a unique plane. Because the orbits are circular, and because the inclination of the orbital plane to the line of sight can be determined with reasonable precision, the projection of the velocities onto the line of sight can be reliably determined. Furthermore, because the orbits are circular, and the galaxies exhibit circular symmetry in the plane of the orbits, the rotation velocities are the product of a constant potential. Therefore, except for the rather small uncertainty caused by the unknown three dimensional shape of the mass distribution, the mass contained within a given radius may be obtained without ambiguity.
There now exists a large body of data, obtained from optical and 21 cm observations (vid Rubin 1987, Sancisi and van Albada 1987). One careful recent analysis, consistent with earlier work, is by Athanassoula et al. (1987). Using rotation curves and optical photometry, they construct composite models containing a stellar disk and bulge and a dark halo. Mass-to-light ratios of the stellar disks are consistent with the predictions of stellar population models, ranging from 1 for the bluest galaxies to 6 for the reddest. The stellar component dominates the central parts, but at larger radii the halo begins to dominate, causing the global mass-to-light ratio to rise by a factor of 2 to 3 by the outer edge of the galaxy. The halo mass distributions are consistent with those of unbounded isothermal spheres, out to several tens of kiloparsecs. These results are shown as the cross-hatched areas in Fig. 2. The lateral extent of these areas indicates the range of separations to which they apply, while the height is my estimate of the uncertainty in the mean. Also shown, as a smooth curve, is the run of interior mass-to-light ratio with radius in NGC 3198 (Sancisi and van Albada 1987).
Mass determinations at larger radii are dependent on other, less reliable estimators. The most commonly used has been binary galaxies, which, for most samples, measure the mass at separations of order 50 h-1 kpc. The analysis of binary galaxy data is an extremely difficult problem, with a long and very controversial history. The relative velocities are small, and their measurements prone to error. The selection of an uncontaminated sample of true binary galaxies entails very large selection effects. And, the shapes of the orbits and their projection on the sky are unknown a priori. Together, these problems result in a potential for systematic error of at least an order of magnitude. However, in recent years considerable progress has been made in gathering reliable observations and in understanding the systematic effects. Two recent papers by White et al. (1983), and by Schweitzer (1988) illustrate the present state of the subject. Using an analytic model of the intrinsic distribution of galaxy separations, White et al. find that their data require the binary members to be on circular orbits, and to have unbounded mass distributions, such that, on my scale
On the other hand, Schweizer (1988), using an empirically determined distribution of separations, found that her data suggested that binary members are on very elongated orbits and have bounded mass distributions, no more extended than about 35 h-1 kpc The mean total mass-to-light ratio of her early-type binaries is 40. The inconsistencies between these findings are obvious. However, equally noteworthy, I think, is that the deduced M/L' s are, in fact, very consistent at the scales on which they have information. This may be seen in Fig. 2, where these results are shown as unfilled boxes.
An alternate method for obtaining masses, using the hot gaseous coronae of elliptical galaxies is, in principle, much superior. If the coronae are in thermal and hydrostatic equilibrium, one may determine total mass as a function of radius, with no ambiguity, using measurements of the run of temperature and emissivity with radius. In practice existing data do not provide much information on temperature gradients, and low emissivity of the gas at large radii (emissivity is proportional to gas density squared) limits the scales over which masses can be determined. Nevertheless, fairly reliable mass estimates are available for some galaxies; the results of Forman, Jones, and Tucker (1985) are shown in Fig. 2 as small filled circles.
At somewhat larger scales, small groups of galaxies can be used.
Although subject to their own systematic errors, particularly due to
contamination by foreground and background galaxies, the selection
effects in group dynamics are considerably less severe than in
binaries. One careful analysis by
Huchra and Geller (1982)
uses quantitative criteria to find well-defined groups of nearby
galaxies. The scatter in the M/L values of individual groups is large,
because of statistical fluctuations from the very small numbers of
galaxies observed within each group. However, the median value of M/L is
probably reliable. On my system, M/L)E
 100, with an estimated
uncertainty of about a factor of 2.
Turner et al. (1979)
have handled
the problem of contamination and statistical fluctuations by comparing
real groups cataloged by
Turner and Gott (1976)
with a simulated
catalog of groups constructed from N-body clustering models of the
universe. The also find a mean M/L of about 100, and show that the
large observed spread in the values of M/L of individual groups is,
indeed, the result of sampling statistics.
100, with an estimated
uncertainty of about a factor of 2.
Turner et al. (1979)
have handled
the problem of contamination and statistical fluctuations by comparing
real groups cataloged by
Turner and Gott (1976)
with a simulated
catalog of groups constructed from N-body clustering models of the
universe. The also find a mean M/L of about 100, and show that the
large observed spread in the values of M/L of individual groups is,
indeed, the result of sampling statistics.
Clusters of galaxies measure yet larger scales, typically several megaparsecs. The galaxy samples within rich clusters are sufficiently large that sampling fluctuations, and contamination from foreground and background objects, become unimportant. Several methods are available for estimating cluster masses. If one assumes that the radial distribution of the mass is the same as that of the galaxies, and that the distribution of velocity vectors of the galaxies is isotropic, one can calculate, as did Zwicky, the total cluster mass from the space distribution and velocity dispersion of the galaxies. If, however, one relaxes these two assumptions, a unique solution becomes more elusive. This problem has been recently analyzed by Merritt (1987) and by The and White (1986). Both find that, with reasonably isotropic galaxy orbits, the data is most consistent with a mass distribution identical to the light distribution. However, if one allows the galaxy orbits to become progressively more circular or more elongated with increasing distance from the cluster center, it is possible to fit models in which the mass is either more or less concentrated than the galaxies. This variety of models results in total derived masses of the cluster which may be at least a factor of two greater or less than that derived if the mass distribution is the same as the galaxy distribution.
In principle, x-ray observations of the hot intracluster gas can provide very important constraints on these mass models. The gas of atoms, unlike the gas of galaxies, is dominated by collisions. Also, its kinetic energy content can be determined from its emission spectrum, with no uncertainties due to particle orbits. Therefore, if it is in hydrostatic equilibrium, its local temperature and density gradients allow us to determine the run of M(r), without prior assumptions about the overall mass distribution. Unfortunately, existing x-ray data does not provide complete temperature information, nor do observations extend to large enough distances from the cluster centers to measure the outer parts of the cluster mass. The implications of existing x-ray observations of the Coma Cluster have been discussed by Cowie, Henriksen and Mushotzky (1987) and by The and White (1988). Cowie et al. assert that the data require that the mass distribution of Coma be much more centrally concentrated than the galaxies, and the total mass be less than that usually derived from optical data. However, The and White show that a simultaneous solution using both the optical and x-ray data suggests that, while the mass is somewhat more concentrated than the galaxies in the cluster core, the two have the same distribution over most of the observed range in radii. Assuming that the mass is distributed like the galaxies, Oemler and Tucker (1988) have used optical and x-ray observations of clusters to derive a mass-to-light ratio of cluster galaxies of about 100, with an uncertainty of perhaps 30 percent. They show that the somewhat higher values found in the richest clusters is due to an unusually low efficiency of galaxy formation there. This value is shown in Fig. 2 as an open circles. The large error bar reflects the systematic uncertainty in mass distributions as well as the random errors.
Clusters of galaxies are the largest systems which have reached a
steady state. All larger systems are still collapsing, and their
dynamics must be analyzed using a model for the growth of clustering
in the expanding universe. These models produce, directly, an
estimate of  0. To
convert to mass-to-light ratios, I use the cosmic luminosity density,
0. To
convert to mass-to-light ratios, I use the cosmic luminosity density,
 V = 2.3
× 108h L0 Mpc-3,
derived by
Kirshner et al. (1983).
(That luminosity density is contributed, in large part, by
spirals, so a further conversion is necessary to obtain M/L)E.
V = 2.3
× 108h L0 Mpc-3,
derived by
Kirshner et al. (1983).
(That luminosity density is contributed, in large part, by
spirals, so a further conversion is necessary to obtain M/L)E.
The cosmic virial theorem (see e.g.
Peebles 1980)
relates the kinetic
and potential energy content of the clustered matter in the universe.
Bean et al. (1983)
and Davis and Peebles
(1983)
have used
independent estimates of the amplitude of galaxy clustering and of
peculiar velocities to obtain
0 by this
means. Bean et al. find
0
0.14, uncertain to a factor
of 2, equivalent to
M/L)E 110.
Davis and Peebles, with somewhat larger values of correlation
function and peculiar velocities, find
0
0.2, equivalent
to M/L)E
150, with an uncertainty of about 50 percent. The length scale
to which these estimates are relevant are about the correlation
length, which these authors estimate as between 4 h-1
and 5 h-1 Mpc.
These results are presented in Fig. 2 as large
filled circles.
The largest scale on which useful dynamical measurements exist is that
of the local supercluster, in which the peculiar velocity of the Local
Group and other outlying members of the supercluster, relative to the
global Hubble expansion, provide a measure of the excess interior
mass. A number of determinations of that peculiar velocity,
vp have
been made. When combined with estimates for the relative overdensity
in the supercluster, these yield estimates of
0 which have ranged
from as little as 0.04, derived from a low vp and high
overdensity
(Yahil, Sandage, and
Tammann 1979)
to as high as 0.5, using a large vp
and small overdensity
(Tonry and Davis, 1981).
As best available
estimates, I have used the value of vp = 280 ± 60 km
s-1 derived by
Aaronson et al. (1982)
using the Tully-Fisher relation for spiral
galaxies, and the overdensity,
 /
= 2.0 ± 0.2,
found by
Davis and Huchra (1982)
from the CFA survey. These values imply
0 = 0.16
± 0.06, or M/L)E = 120 ± 43.
/
= 2.0 ± 0.2,
found by
Davis and Huchra (1982)
from the CFA survey. These values imply
0 = 0.16
± 0.06, or M/L)E = 120 ± 43.
What is really needed, of course, is the global value of
0. If the
cosmological constant,  =
0.0, this may be obtained from a
measurement of the cosmological deceleration parameter,
q0. Although
the pursuit of this number is 50 years old, we appear, alas, to be
little closer to a reliable determination than we were decades ago. We
may, however, determine at least that fraction of the mass density
which is contributed by baryons from a measurement of the primordial
abundances of the light elements D, 3He, 4He, and
7Li, whose
production in the big bang is very sensitive to density. A recent
discussion of the subject by
Boesgaard and Steigman
(1985)
suggests a
lower limit, set mainly by the abundances of D and 3He of
0
h2 > 0.01.
New theoretical and observational work on the abundance of 7Li
(Deliyannis et al. 1988)
suggest and upper limit
0
h2 < 0.04. These
translate into a range of M/L)E between 32 and 130. This range is
shown as the shaded area at the right edge of
Fig. 2.
=
0.0, this may be obtained from a
measurement of the cosmological deceleration parameter,
q0. Although
the pursuit of this number is 50 years old, we appear, alas, to be
little closer to a reliable determination than we were decades ago. We
may, however, determine at least that fraction of the mass density
which is contributed by baryons from a measurement of the primordial
abundances of the light elements D, 3He, 4He, and
7Li, whose
production in the big bang is very sensitive to density. A recent
discussion of the subject by
Boesgaard and Steigman
(1985)
suggests a
lower limit, set mainly by the abundances of D and 3He of
0
h2 > 0.01.
New theoretical and observational work on the abundance of 7Li
(Deliyannis et al. 1988)
suggest and upper limit
0
h2 < 0.04. These
translate into a range of M/L)E between 32 and 130. This range is
shown as the shaded area at the right edge of
Fig. 2.
The straightforward interpretation of Fig. 2 is clear. Mass is more smoothly distributed than light on scales of 100 h-1 kpc and less, because of the existence of heavy galactic halos. On larger scales, mass and light have a constant ratio, about 100 in solar units. Since this value is within the range allowed by primordial nucleosynthesis, the total mass density of the universe may be due to baryons. Such a picture is completely consistent with known astrophysics, which provides a natural means, dissipation of the heat content of gas by radiation, to segregate matter on scales of a galaxy, but no simple mechanism to do so on larger scales.
There are, however, other possible interpretations of these
results. All existing mass determinations on scales larger than 100
h-1
kpc must make the explicit assumption that light does trace matter in
order to measure the mass. If the matter is more extended than the
light, M/L will be underestimated. If, for example, the West and
Richstone mechanism for segregation in clusters does operate, virial
mass estimates will systematically underestimate total masses and
mass-to-light ratios. As we have seen, the internal dynamics of
clusters are entirely consistent with no segregation, but they cannot
rule it out. One could, then, imagine that true values of M/L do
continue to rise on scales larger than 100 h-1
kpc. Obtaining an
increase sufficiently large to be consistent with
0 = 1 will
not, however, be easy. We expect that, on scales larger than about 50
h-1 Mpc, light
will trace mass. Unless the universe is dominated by a completely
smooth, very hot component, which is difficult to arrange, we would
expect the excess clumpiness of the light relative to the matter, and
therefore the degree of underestimation of M/L, to smoothly decrease
as the size of systems increases. For that smooth increase, from
values of order 100 on scales of 100 h-1 kpc to values
of about 800 on
scales of 50 h-1 Mpc, to be completely disguised on
all scales up to
12 h-1 Mpc may be difficult to contrive.
4.1 Tests of Biased Galaxy Formation
Undeterred by the lack of any evidence for the existence of segregation of mass and light on large scales, we shall now look for signs, in the galaxy population, that some process of biased galaxy formation is, indeed, operating. As discussed earlier, possible evidence will be any variations with environment in the properties of galaxy populations. One such variation has been known for 50 years: although the majority of galaxies in the universe are spirals, the cores of rich clusters contain very few. One possible way of describing this phenomenon was developed by Dressler (1980), who showed that galaxy populations within clusters are correlated with the local surface density of galaxies. The fractions of E's and SO's are an increasing, and the fraction of spirals a decreasing function of density. Postman and Geller (1984) provided a significant extension of this relation. The showed that morphology was an equally sensitive function of space density, which is the more relevant physical quantity. The also showed that the dependence extended to even lower densities than Dressler had studied in clusters.
An alternate look at the same phenomenon is provided by the galaxy autocorrelation function. Davis and Geller (1976) showed that the angular correlation function of ellipticals is steeper and, at small separations, higher than that of spirals. The SO correlation function is intermediate between those of spirals and ellipticals. Giovanelli, Haynes, and Chincarini (1986) have shown that the amplitude and radial dependence of the angular correlation function of galaxies in the vicinity of the Perseus-Pisces Supercluster steadily decreases along the Hubble sequence, and is highest for early types and lowest for latest types. Davis and Djorgovski (1985) have found a similar difference between the angular correlation functions of high and low surface brightness spirals.
These differences will not, by themselves, bias the observed distribution of galaxies: ellipticals and spirals are included almost equally in any magnitude limited sample. Might they, however, be the visible signs of some process which does bias the entire distribution? A significant clue that they are not was provided by Postman and Geller. They found that the dependence of morphology on density does not extend to very low densities. Below a density equal to about ten times the cosmic mean, morphology is independent of density. Postman and Geller noted that this density corresponded to groups in which the crossing time was equal to the Hubble time, suggesting that dynamical interactions between galaxies after formation are responsible for population differences. I had earlier reached the same conclusion, from an examination of the populations in clusters. (Oemler 1974). Whatever the dependence on local density, it is also a fact that cluster populations are strongly correlated with the global dynamical state of the cluster (Butcher and Oemler 1979). The cores of collapsed, relaxed clusters are almost devoid of spirals, while irregular, apparently unrelaxed clusters contain many.
The conclusion that dynamical interactions, rather than biased galaxy formation, is responsible for morphological segregation is reinforced by a significant coincidence in the scale of several phenomena. Davis and Geller (1976) found that the angular correlation functions of elliptical and spiral galaxies in the UGC catalog (Nilsen 1976) were equal at a scale of about 2 degrees. There is little evidence, from their data, that they do not remain the same of larger scales. The angular correlation functions of the high and low surface brightness UGC galaxies in Davis and Djorgovski's sample (1986) are also different only on scales less than 2 degrees. The typical depth of the UGC catalog is about 4000 km s-1; thus, 2 degrees corresponds to 1 1.3 h-1 Mpc. As I shall describe later, Eder et al. (1988) have found that the correlation function of faint dwarf galaxies differs from that of giants only on scales less than 1 h-1 Mpc. Now, the peculiar velocities of galaxies are about 300 km s-1, almost independent of separation (Bean et. al 1983, Davis and Peebles, 1983). Therefore, a crossing time of 5 h-1 billion years (expansion and recollapse in a Hubble time) corresponds (roughly) to a separation of 1.5 h-1 Mpc. Thus, all observed morphological separation only occurs in environments in which interactions between galaxies can occur, which strongly suggests a causal connection. Finally, one should note that, even if one persists in ascribing these differences to biased galaxy formation, the process only works on scales of a few megaparsecs, and cannot affect the large scale distribution of galaxies.
As mentioned earlier, a more direct test of many biasing models can be derived from the relative distribution of high and low mass galaxies. Such samples are more difficult to obtain, and only a limited amount of data is available. There is no evidence that the luminosity function of galaxies varies significantly with environment. Kirshner et al. (1983) found that the luminosity function of cluster galaxies was, within the rather considerable uncertainties, the same as that of field galaxies. Phillips and Shanks (1987) have indirectly estimated the relative correlation functions of bright and faint galaxies, and have found them to be the same, but with large uncertainties. Thuan, Gott, and Schneider (1987) have shown that a sample of 58 dwarf irregulars have qualitatively the same spatial distribution as the bright galaxies in the same region volume.
Two studies of the distribution of one sample of dwarf galaxies have found significance evidence for segregation. Sharp, Jones, and Jones (1978) have looked at the angular cross-correlation of galaxies in the Catalog of Galaxies and Clusters of Galaxies (Zwicky et al. 1961-1968) with a sample of dwarf irregulars studied by Fisher and Tully (1975). They find the dwarfs to be more weakly correlated with the luminous galaxies than the latter are with themselves, suggesting that they are less clustered. White, Tully, and Davis (1988) have recently analysed the space distribution of galaxies in the Nearby Galaxies Catalog (Tully 1988), which is, basically, a merging of the Shapley-Ames catalog of bright galaxies with Tully and Fisher's sample of dwarfs. Catalog members were subdivided into 4 groups by their internal velocities, vi. The quantity vi measures the depth of the galactic potential well, and is the most relevant physical quantity for many biasing mechanisms. White, Tully, and Davis find that luminous, high vi galaxies are much more concentrated to the densest regions than are low vi dwarfs. The degree of segregation agrees very well with that predicted by the biased cold dark matter model of White et al. (1987).
Unfortunately, as Eder et al. (1988) have shown, their are substantial problems with this sample of galaxies. As White, Tully, and Davis point out, most of the signal for a segregation comes from a few rich clusters, particularly the Virgo Cluster. Eder et al. demonstrate that the Tully sample is 90 percent incomplete for low vi galaxies within Virgo. Overall, the incompleteness for the low velocity galaxies is about 50 percent. Therefore, the dwarf galaxies in these two studies avoid clusters because the sample does, not because of any intrinsic difference in distribution.
Because of the problems with existing samples of dwarf galaxies, we have constructed a new sample, in the vicinity of a nearby void (Eder et al. 1988). Although small - about 100 galaxies - it is well defined and homogeneous over the survey area. The objects are true dwarfs, with typical internal velocity widths of 100 km s-1 We have used correlation functions and nearest neighbor distributions to compare the spatial distribution of these dwarfs with that of two samples of luminous galaxies: those in the CFA catalog, and those in the survey of UGC spirals by Giovanelli and Haynes (1985). At separations larger than 1 h-1 Mpc, the distributions are identical; there is no sign of any segregation. At separations of less than 1 h-1 Mpc, the lower velocity width dwarfs, those with vi < 100 km s-1, are underabundant by a factor of about 10. As mentioned earlier, I suspect that this depletion is the result of the same processes of galaxy-galaxy interactions which is responsible for the morphology-density relation among galaxies.