Copyright © 1993 by Annual Reviews. All rights reserved
| Annu. Rev. Astron. Astrophys. 1993. 31:
689-716 Copyright © 1993 by Annual Reviews. All rights reserved |


3.2. Low Redshift Galaxy and Cluster Distributions
In a classic study,
Davis & Peebles (1983)
found that the bright galaxies
were correlated in position with the two-particle correlation function in
real space being approximately
 = (rh/5.4
Mpc)-1.8; confirmed by more recent results of
deLapparent et al
(1988).
How well do CDM simulations match this fundamental observational fact?
In a P3M (high resolution)
simulation utilizing ~ 105.5 particles,
White et al (1987)
examined the evolution in a relatively small (25h-1
Mpc) box with a low assumed
amplitude
= (rh/5.4
Mpc)-1.8; confirmed by more recent results of
deLapparent et al
(1988).
How well do CDM simulations match this fundamental observational fact?
In a P3M (high resolution)
simulation utilizing ~ 105.5 particles,
White et al (1987)
examined the evolution in a relatively small (25h-1
Mpc) box with a low assumed
amplitude  8 =
0.4. The mass auto-correlation function is approximately
a factor of 4 below the observations, and the "galaxies," picked with a
plausible biasing scheme that matches the halo circular velocities to those
of bright spirals, are reasonably consistent with the
Davis & Peebles (1983)
data. But it is clear that, had they used the much higher COBE
normalization, the correlation function would have been too high, by
approximately a factor of three, and too steep as well. A more recent study
by Park (1990),
utilizing a much larger (307 h-1 Mpc) box with many
more particles (N = 106.3) but lower spatial
resolution (~ 1.5 h-1 Mpc), adopted a slightly larger
(8 = 0.5)
normalization. He finds a fairly
good fit to observations if b8 = 2, indicating
consistency with the earlier
work where a very different numerical method was used.
Cen & Ostriker (1992a)
in a simulation, which combined gas dynamics with a dark
matter code, adopted a still higher normalization
(8 = 0.67)
and found real bias, as expected, and slightly too high a galaxy-galaxy
correlation function.
8 =
0.4. The mass auto-correlation function is approximately
a factor of 4 below the observations, and the "galaxies," picked with a
plausible biasing scheme that matches the halo circular velocities to those
of bright spirals, are reasonably consistent with the
Davis & Peebles (1983)
data. But it is clear that, had they used the much higher COBE
normalization, the correlation function would have been too high, by
approximately a factor of three, and too steep as well. A more recent study
by Park (1990),
utilizing a much larger (307 h-1 Mpc) box with many
more particles (N = 106.3) but lower spatial
resolution (~ 1.5 h-1 Mpc), adopted a slightly larger
(8 = 0.5)
normalization. He finds a fairly
good fit to observations if b8 = 2, indicating
consistency with the earlier
work where a very different numerical method was used.
Cen & Ostriker (1992a)
in a simulation, which combined gas dynamics with a dark
matter code, adopted a still higher normalization
(8 = 0.67)
and found real bias, as expected, and slightly too high a galaxy-galaxy
correlation function.
All these studies consistently indicate that adopting the COBE normalization would produce unacceptable results. One could object to these tests because they use one assumed quantity b, which could well be in error. However, recent detailed numerical hydrodynamical work (Cen & Ostriker 1992b, Katz et al 1992) derives a physical bias of galaxies over matter in the range b8 = 1.5-2.0 which is roughly consistent with prior assumptions. Thus CDM, normalized to COBE, appears to predict too high and too steep a correlation function; i.e. there is too much power on the (5-10) h-1 Mpc scale.
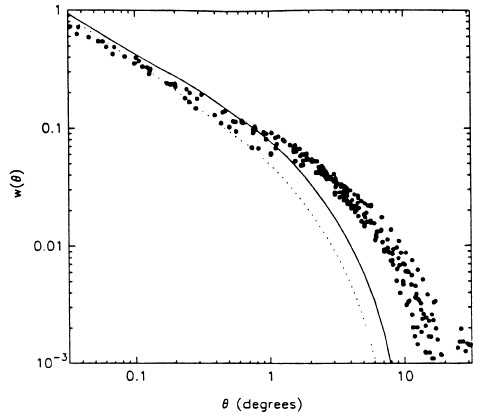
There are also other difficulties, which are normalization independent, evident on large spatial scales. For example, in an analysis of more than one million galaxies in the APM survey, Maddox et al (1990) find that the two-point angular correlation function between bright galaxies, when fit to the observations on the 0.03-0.3 degree scale, is significantly below the observations on scales greater than 1 degree, when these are scaled to the depth of the Lick survey (cf Figure 4, Efstathiou 1991b). The authors conclude "our survey provides strong evidence for large-scale power in the galaxy distribution which is difficult to reconcile with the standard CDM model." The objectively selected IRAS sample studied by Saunders et al (1991) led to a similar conclusion. Analysis of three-dimensional data assembled from redshift surveys by Vogeley et al (1992) leads one to the same conclusion: The power spectrum of the galaxy number fluctuations substantially exceeds the prediction of the CDM model (spectrum shape not amplitude being tested) at wavelengths in excess of 60 h-1 Mpc. Loveday et al (1992), from an independent redshift survey of a subset of the APM-Stromlo galaxies, also find that the observations indicate significantly more large-scale power than is permitted by the standard CDM model.
Now let us turn to the largest scales, which are measured by the cluster-mass function, cluster-cluster correlations, and the distribution of voids and shells.
Clusters of galaxies, recognized by
Zwicky (1933)
as unique cosmological
tracers, provide two types of tests for the model builders. Can
their theories construct objects with the right mass and size in the
observed
abundance, and can the spatial correlations amongst their positions be as
it is observed? Peebles et al
(1989;
an analysis of earlier work is contained
in this paper) find that no combination of the CDM amplitude and the
cluster biasing parameter can be found to fit the data.
Frenk et al (1990),
on the contrary, did conclude that the model could be fit to observations,
but only for 8
= 0.4-0.5, considerably below the COBE
normalization. In a more recent study,
Bahcall & Cen (1992)
reanalyzed the cluster data
in light of new numerical simulations and the COBE
observations. If one adopts the COBE normalization for CDM
(8
 1.05), one predicts far
too many clusters of galaxies per unit volume: The discrepancy is a factor
of 5 at 1013.5
M
1.05), one predicts far
too many clusters of galaxies per unit volume: The discrepancy is a factor
of 5 at 1013.5
M (within
the Abell radius) and over two orders of magnitude at 1015
M
Lowering the amplitude arbitrarily by a factor of two
(to approximately the
Frenk et al 1990
level) improves the situation but, once again, the predicted shape is
wrong; no amplitude can successfully
predict both the high and low mass cluster abundances.
(within
the Abell radius) and over two orders of magnitude at 1015
M
Lowering the amplitude arbitrarily by a factor of two
(to approximately the
Frenk et al 1990
level) improves the situation but, once again, the predicted shape is
wrong; no amplitude can successfully
predict both the high and low mass cluster abundances.
|
Figure 4 Angular galaxy-galaxy correlation
functions
|
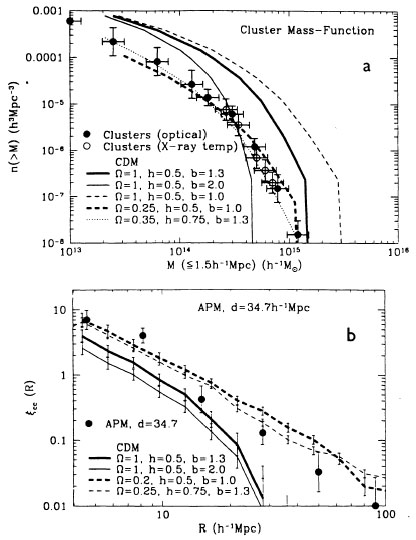
The cluster-cluster correlation function is less well observed, but both
the Abell (R > 1) clusters and those culled from the APM
survey indicate
that standard CDM cannot account for cluster correlations on scales in
excess of 20 h-1 Mpc regardless of the normalization
of the spectrum.
These results are shown in Figure 5 from
Bahcall & Cen (1992).
Doubts concerning the reality of some of the observed clusters (cf
Frenk et al 1990)
do not alter these conclusions, since, if the cluster numbers are adjusted
to fit the theory, then an amplitude is found
8 < 0.5,
Frenk et al 1990)
that is strongly discrepant with the COBE normalization. We will not
discuss the galaxy-cluster correlations here. Suffice it to say that
they lead one to the same conclusions as the galaxy-galaxy data and the
cluster-cluster data.
|
Figure 5 Clusters of galaxy
data compared to CDM models
(Bahcall & Cen 1992).
(a) The cluster mass functions from observations and from CDM
simulations. The COBE
normalization of the standard model (light dashed curve)
overproduces clusters. Only the
nonstandard |
The distribution of voids provides evidence complementary to that of the clusters. Can a model successfully predict the emptiness of large volumes of space? While visually striking (cf pictures and discussion in Geller & Huchra, 1989), the evidence is difficult to use in confrontation with the models. The reason is that, on the one hand, we have little observational information concerning low luminosity (dwarf) galaxies in the voids, and on the other, the theories are vague concerning the dependence of "bias" on galaxy luminosity. Nominally one expects, in the CDM model, that the voids will be populated to a degree larger than is observed (Peebles 1989), but, in the absence of agreed upon theories of galaxy formation, it is difficult to quantify this apparent disagreement.
The most astonishing very large-scale structure result published to date derives from the deep pencil beam study of Broadhurst et al (1990). Over a scale of more than 1000 h-1 Mpc, these authors found an apparently periodic distribution in the density of galaxies with a wavelength close to 130 h-1 Mpc. Because of extreme undersampling, it has been difficult to interpret these observations. While nonconventional interpretations come readily to mind, Frenk (1991) and Park & Gott (1991) agree that, in a standard CDM universe, one might, some reasonable fraction of the time, see structures like those observed in the narrow pencil beam surveys. Only when many more independent lines of sight are observed will one be able to firm up this argument.
The other very large-scale structures seen by Tully (1987), in the distribution of clusters on scales up to z = 0.1, do appear to require largescale power in excess of that offered by the standard CDM model but consistent with that found in the somewhat better determined cluster-cluster correlations (cf Postman et al 1989).
In summary, on scales greater than 10-15 h-1 Mpc, the galaxy-galaxy, galaxy-cluster, and cluster-cluster correlations are larger than can be accommodated in the standard CDM model and no ready combination of theoretical parameter adjustments or allowance for observational biases and errors seems able to bridge the gap.
 (
( ) from
 = 1 biased CDM
model with h = 0.5 (dotted line) and h = 0.4
(solid line). Note that the shape is wrong, regardless of
normalization.
= 1 biased CDM
model with h = 0.5 (dotted line) and h = 0.4
(solid line). Note that the shape is wrong, regardless of
normalization.