Copyright © 1998 by Annual Reviews. All rights reserved
| Annu. Rev. Astron. Astrophys. 1998. 36:
267-316 Copyright © 1998 by Annual Reviews. All rights reserved |


3.4. The Column Density Distribution
In absorption line studies, the column density distribution function
(CDDF), i.e., the number of absorbers in a given column density bin
occupies a similarly, central place (and
provides similarly vague information) as the luminosity function in the
study of galaxies. The observational determination of the CDDF relies
on a patchwork of techniques, owing to the large dynamic range of
observable HI absorption. The CDDF can be measured relatively
unambigously from Voigt profile fitting for column densities between
N(HI) greater than a few times 1012 cm-2, the
detection limit
for typical Keck spectra, to about a few times
1014cm-2,
where the linear part of the curve of growth ends. The weakest lines
(N(HI)  1013 cm-2) are so numerous that they begin to
overlap, requiring application of confusion corrections
(Hu et al. 1995).
Above ~ 1014 cm-2, once a line is saturated,
there is a certain degeneracy between a small change in apparent line
width and a large change in column density. Then the column densities
are relatively difficult to measure exactly by any means. The situation
is complicated further by the appearance of noticeable
multi-component structure in absorption systems with column densities
above 1015 cm-2 (e.g.,
Cowie et al 1995).
Blending among these components due to the large thermal width of the
(already saturated) Ly
1013 cm-2) are so numerous that they begin to
overlap, requiring application of confusion corrections
(Hu et al. 1995).
Above ~ 1014 cm-2, once a line is saturated,
there is a certain degeneracy between a small change in apparent line
width and a large change in column density. Then the column densities
are relatively difficult to measure exactly by any means. The situation
is complicated further by the appearance of noticeable
multi-component structure in absorption systems with column densities
above 1015 cm-2 (e.g.,
Cowie et al 1995).
Blending among these components due to the large thermal width of the
(already saturated) Ly can
mimick large Doppler parameter/ high column
density lines. Simultaneous fits to the higher order Lyman lines (which
are less saturated owing to their lower oscillator strengths) can only
help to some degree. Eventually, for systems with column density
N(HI)
can
mimick large Doppler parameter/ high column
density lines. Simultaneous fits to the higher order Lyman lines (which
are less saturated owing to their lower oscillator strengths) can only
help to some degree. Eventually, for systems with column density
N(HI)  1017
cm-2 the discontinuity at the Lyman limit (LL)
can be observed (1017.3 cm-2 corresponds to
1017
cm-2 the discontinuity at the Lyman limit (LL)
can be observed (1017.3 cm-2 corresponds to
 LL ~ 1) giving
again a relatively precise measure of the HI column
(Lanzetta 1988;
Sargent et al 1989).
From N
1018.5 on, the damping wings of
Ly become detectable. The
line width is now entirely a measure
of the column density and can again be read off by Voigt profile
fitting, or, in lower resolution data, directly from the equivalent width
(Wolfe et al 1986).
LL ~ 1) giving
again a relatively precise measure of the HI column
(Lanzetta 1988;
Sargent et al 1989).
From N
1018.5 on, the damping wings of
Ly become detectable. The
line width is now entirely a measure
of the column density and can again be read off by Voigt profile
fitting, or, in lower resolution data, directly from the equivalent width
(Wolfe et al 1986).
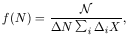
Carswell et al. (1984)
found that the number of absorbers
 per unit HI column density
interval can be parametrized as
per unit HI column density
interval can be parametrized as
| (10) |
Tytler (1987a)
has drawn attention to the remarkable fact that when results from higher
column density surveys are included a single power law with slope
 = 1.5 fits the whole
range of observable column densities well. Keck spectra
(Hu et al. 1995,
Lu et al. 1996,
Kirkman & Tytler 1997,
Kim et al. 1997)
appear to show that the the power law extends
over ten orders of magnitude in column density from 1012 to
1022 cm-2
(if the confusion correction made at the low column density end is
justified). A customary working definition of the CDDF
(Tytler 1987a)
is
= 1.5 fits the whole
range of observable column densities well. Keck spectra
(Hu et al. 1995,
Lu et al. 1996,
Kirkman & Tytler 1997,
Kim et al. 1997)
appear to show that the the power law extends
over ten orders of magnitude in column density from 1012 to
1022 cm-2
(if the confusion correction made at the low column density end is
justified). A customary working definition of the CDDF
(Tytler 1987a)
is
| (11) |
which gives the total number
of absorbers in HI column density bin
[N, N +  N],
found over the total surveyed redshift distance
N],
found over the total surveyed redshift distance
 i
iX, where
X has been defined earlier.
i
iX, where
X has been defined earlier.
One of the more recent measurements (Hu et al 1995) gives

| (12) |
Various authors
(Bechtold 1987;
Carswell et al 1987,
Petitjean et al. 1993;
Meiksin & Madau 1993;
Giallongo et al 1993)
have presented evidence
for departures from a single power law which seem to be borne out by
the new Keck data. A steepening for
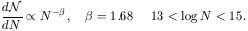
log N 14
explains why individual high resolution spectra tend to yield
~ 1.7 - 1.8 for the regions
(log N ~ 13-15) for which they are most sensitive (e.g.
Carswell et al. 1984,
1987;
Atwood et al 1985;
Rauch et al 1992).
In the high column density range (beyond log
N ~ 16) f (N) flattens and damped systems are more
abundant than
they should be judging from an extrapolation of the lower column
density power law. Weak evolution of f (N) may occur in
the sense that this turnover moves slightly with redshift
(Carswell et al 1987,
Kim et al. 1997)
but the evidence is currently not overwhelming,
given that the dip in f (N) occurs in a column density
range, where the determination of N(HI) is least certain (see above).