Copyright © 1997 by Annual Reviews. All rights reserved
| Annu. Rev. Astron. Astrophys. 1997. 35:
445-502 Copyright © 1997 by Annual Reviews. All rights reserved |


2.1. Continuum Variability in the Optical, UV, EUV, and IR Ranges
THE DATA BASE: RICH AND INHOMOGENEOUS Most results come from three AGN - NGC 4151, NGC 5548, and 3C 273 - that have been observed extensively in numerous coordinated campaigns in the IR, optical, UV, and X-ray ranges. NGC 4151 is an exceptional AGN in terms of the richness of its phenomenology and the quantity and variety of the data available. Of the brightest AGN, it varies on the shortest time scale. NGC 5548, another nearby bright AGN, has been observed in several multiwavelength campaigns, including 7 years of nearly daily spectrophotometric monitoring in the optical (Peterson et al 1994).
The quasar 3C 273 is the only extensively studied very high-luminosity AGN, with Lbol ~ 2.5 × 1047 erg s-1. It displays some blazar characteristics (jet and VLBI source) but also has a strong blue bump and emission lines that indicate that the optical-UV is dominated by the non-blazar component. Two dozen AGN have been observed in smaller campaigns, some with multiwavelength coverage. The results are in agreement with and extend those obtained from the three intensively observed objects.
IR-EUV TIME SCALES, AMPLITUDES, AND SPECTRAL SHAPE On time scales of many decades, data are available only for NGC 4151. Multifractal analysis of B-band photometry from 1911-1991 clearly suggests a nonlinear intermittent behavior that, if confirmed, would rule out processes based on shot noise or on the superposition of a very large number of independent events (Longo et al 1996). The data were also searched for evidence of periodicity - none was found, confirming earlier results (Lyutyi & Oknyanski 1987, and references therein).
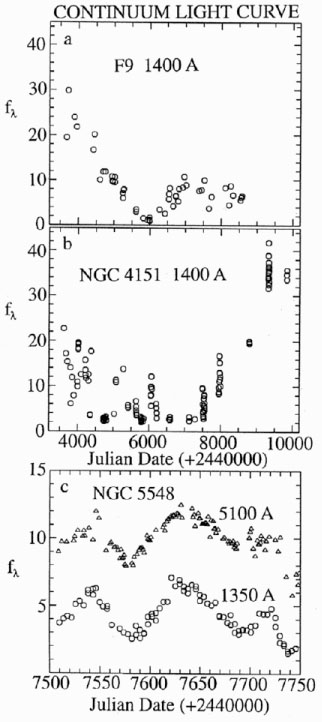
Figures 1 and 2 show examples of variability on time scales of years to a few hours. Remarkable "low states" or "minimum states" characterized by an exceptionally weak continuum flux and the quasi-absence of the broad components of the emission lines have been observed in some AGN (e.g. NGC 1566: Alloin et al 1986; Fairall 9: Clavel et al 1989, Recondo-González et al 1997; NGC 4151) and, given time, could perhaps occur in all AGN. In NGC 4151 (Figure 1b) the prolonged minimum lasted from1981-1987 with short spells at medium bright states (Perola et al 1986, Bochkarev et al 1991, Gill et al 1984, Ulrich et al 1985, 1991).
|
Figure 1. Long- and short-term continuum variations in three low-luminosity AGN:(a) UV light curve of F9 over 14 years (Recondo-González et al 1997). (b) UV light curve of NGC 4151 over 17 years. The passage through the deep minimum was interrupted by short excursions to medium bright level. The vertical groups of points, unresolved on this scale, are IUE campaigns with an adequate sampling interval of typically three days. (c) Optical and UV light curves of NGC 5548 over 8 months (December 1988-July 1989; Clavel et al 1991, Peterson et al 1994). Ordinates in 10-14 erg s-1 cm-2 Å-1. |
|
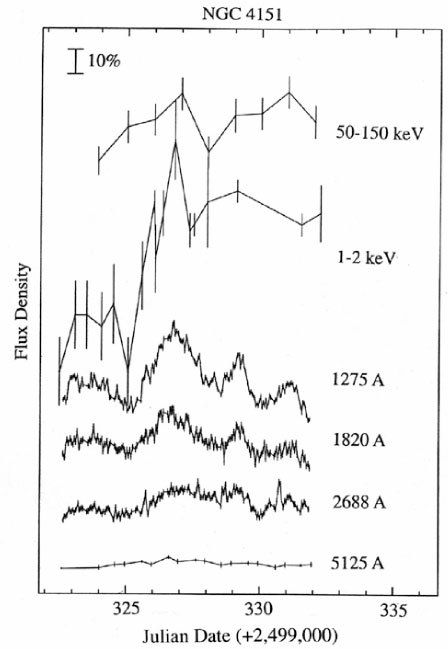
Figure 2. Continuum light curves during the 10-day intensive period of multiwavelength observations of NGC 4151 in December 1993. The light curves are shifted vertically for convenience so a 10% change is indicated by the bar.The largest amplitude variations are in soft X rays. In the optical-UV, the amplitude decreases systematically with increasing wavelength. [From Edelson et al (1996).] Ordinates in erg s-1 cm-2 Å-1. |
These extreme minima provide an opportunity to observe the central nonvarying continuum (such as an underlying starburst or an extended scattered continuum component). Hubble Space Telescope (HST) spectropolarimetric observations at the appropriate epochs(collected as Targets of Opportunity, if necessary) are highly desirable.
An example of optical-UV variability on time scales of months and weeks is shown in the light curves of NGC 5548 from December 1988 to July 1989 (Figure 1c).The power spectrum of the 1400-Å continuum variations is "red," with an exponent between -2 and -3 (Krolik et al 1991). A general feature of all radio-quiet AGN continuum variability is that the amplitude is inversely correlated with the time scale (see Table 1 for examples).In addition, the maxima and minima of the light curves appear to have statistically symmetrical shapes (see Figure 1c), but this property should be investigated more thoroughly.
| Object | Variations |
| Fairall 9 | Continuum variations at 1360 Å, July 1978-Oct 1984:
rmax = 24 in  t ~ 5.5 years
a t ~ 5.5 years
a
|
| Line variations during the 1978-1987 IUE Campaign:
Ly  , CIV, and
MgII varied by factors
10, 7, and 3, respectively, with approximately the same
td of ~ 160 days
(Clavel et al 1989,
Recondo-Gonzalez et al
1997) c , CIV, and
MgII varied by factors
10, 7, and 3, respectively, with approximately the same
td of ~ 160 days
(Clavel et al 1989,
Recondo-Gonzalez et al
1997) c
| |
| 3C 273 | Continuum variations at 1400 Å:
rmax = 2 in t ~ 2 years
|
| Variations of CIV < 10% in 10 years (Ulrich et al 1991) | |
| Variations of
Ly < 10% in 10 years
(Ulrich et al 1993)
| |
| NGC 4151 | Short- and long-term continuum variations at 1400 Å: |
| Factor of 1.3 in 1.5 days (Dec. 1993), 3.3 in 25 days | |
| (Nov.-Dec. 1991), 12 in 6 years (Nov. 1987-Dec. 1993) | |
| (Figures 1 and 2, and Ulrich et al 1991) | |
| Line variations during the Nov.-Dec. 1991 IUE Campaign: | |
| tdb of CIV blue wing, red wing, and whole line are 2.6, 1.9, | |
| and 2.4 days, respectively (Ulrich & Horne 1996) | |
| During the Dec. 1987-July 1988 optical Campaign: | |
td of
H was 9 days for
variations by a factor 1.7
(Maoz et al 1991) was 9 days for
variations by a factor 1.7
(Maoz et al 1991)
| |
| NGC 5548 | Continuum variations at 1400 Å, Dec. 1988-Aug. 1989: |
| Factor 2.45 in 50 days | |
| Line variations during the same IUE Campaign: | |
| Ly,
CIV, and He II lambda 1640
varied by a factor 1.8, 1.8,
| |
| and 4 respectively with td of about 12, 8, and 4 days | |
|
(Krolik et al 1991).
During the same period H
| |
| varied by a factor 1.7 with td of 19 days (Peterson et al 1994). | |
| Other time responses of
H
| |
| NGC 3227 | td ~ 15 days (Salamanca et al 1994, Winge et al 1995) |
| NGC 3516 | td ~ 7 days (Wanders et al 1993) |
| NGC 3783 | td ~ 8 days while td of CIV was 5 days in the same period |
| (Stirpe et al 1994, Reichert et al 1994) | |
| PG 0804+762 | td ~ 93 days (Kaspi et al 1996b) |
| PG 0953+414 | td ~ 110 days (Kaspi et al 1996b) |
| a
t: interval of time
between successive maximum and minimum.
| |
| b td: time delay between the UV lines and UV continuum or between optical lines and optical continuum variations. | |
| c Measurement errors and other uncertainties are detailed in references. | |
On time scales of days and hours, by far the best variability data were collected during the 10-day intensive optical, UV, and X-ray monitoring of NGC 4151 in December 1993 (Figure 2; Crenshaw et al 1996, Kaspi et al 1996a, Warwick et al 1996, Edelson et al 1996). The fastest variations disappear and the overall variability amplitude decreases toward longer wavelengths, as is seen in all AGN (e.g. Kinney et al 1991; Figures 1c and 2). The variability observed with the Extreme Ultraviolet Explorer (EUVE) satellite at 65-120 Å is consistent with this trend (Marshall et al 1997).
The shape of the optical-UV continuum always hardens when the nucleus brightens (Kinney et al 1991, Paltani & Courvoisier 1994), in contrast with BL Lac objects where the spectral shape changes little when the flux varies (Section 6.3).The spectral change occurs because two components with different spectra and variability time scales make up the continuum: the "small blue bump" (2300-4000 Å), which varies with the smallest amplitude and is a sum of permitted Fe II UV and optical multiplets plus the Balmer continuum (Wills et al 1985), and the more variable primary continuum component, whose spectral shape is difficult to determine because of various contaminations. In NGC 5548, this continuum appears to harden when the nucleus brightens (Wamsteker et al 1990, Maoz et al 1993), whereas in Fairall 9 (F9), the optical spectral slope was unchanged while the intensity increased by a factor of 20 (Lub & de Ruiter 1992).
Infrared variations, when detected at all, are of smaller amplitude and longer time scale than in the optical (Neugebauer et al 1989, Hunt et al 1994) and are consistent with being the delayed response of dust around the central source to large amplitude long-term variations of the UV flux, at least for nearby AGN (e.g. Clavel et al 1989, Nelson 1996). Neugebauer and Matthews (G Neugebauer & K Matthews, private communication) have monitored the continua of 25 quasars (5 radio loud) between 1 and 10 µ over a period of up to 25 years.If the 10-µ continuum is caused by thermal emission from dust grains that symmetrically surround the quasar and are in equilibrium with its radiation, the size of the emitting region is such that significant variations would have time scales longer than 100 years. Variations with time scales on the order of years are seen (not surprisingly) in all the radio-loud quasars. In at least one radio-quiet quasar, significant variability on the order of 5-10 years is seen, with correlated variations in all bands. These variations suggest either that the mid-IR emission in some radio-quiet quasars is nonthermal or that quite complicated structures are involved.