Copyright © 1997 by Annual Reviews. All rights reserved
| Annu. Rev. Astron. Astrophys. 1997. 35:
445-502 Copyright © 1997 by Annual Reviews. All rights reserved |


6.5. High Energy Gamma Rays: Where the Action Is
Perhaps the most important progress in the last decade was the discovery with the Compton Gamma-Ray Observatory (CGRO) EGRET instrument that many blazars (presently 40-60, Thompson et al 1995; RC Hartman, private communication) emit enormous power in rapidly variable GeV gamma rays. This gamma-ray emission indicates a second peak in the overall spectral power distribution (Maraschi et al 1994, von Montigny et al 1995; Figure 6).
Practically all EGRET blazars with sufficient statistics and observations are strongly variable on time scales of months (Hartman 1996) and in several cases significant large amplitude flares have been observed on time scales of days, (3C 279: Kniffen et al 1993; PKS 0528+134: Hunter et al 1993). The most extreme example is PKS 1622-297, which brightened by at least a factor of 10 in two days, reaching a peak gamma-ray intensity 5 times that of any previously observed blazar (Mattox 1995, Mattox & Wagner 1996). The gamma-ray spectra of individual blazars appear to harden with increasing intensity (3C 279: Kniffen et al 1993; PKS 0528+134: Mukherjee et al 1996).
In some cases the gamma-ray emission extends to the TeV range (Figure 7). Mrk 421 was the first extragalactic source detected at such energies with the Whipple Observatory (Punch et al 1992), although it is only weakly detected at GeV energies with EGRET (Lin et al 1992). The TeV flux of Mrk 421 is variable by up to a factor of 10 on time scales of a day (Kerrick et al 1995) and by a factor of 5 on a time scale of 30 min (Gaidos et al 1996). Shorter time scales are not presently accessible owing to low event rates. Large-amplitude TeV variability must be frequent as such variations are commonly detected, in contrast with the quiet behavior of the same source in the GeV range.
|
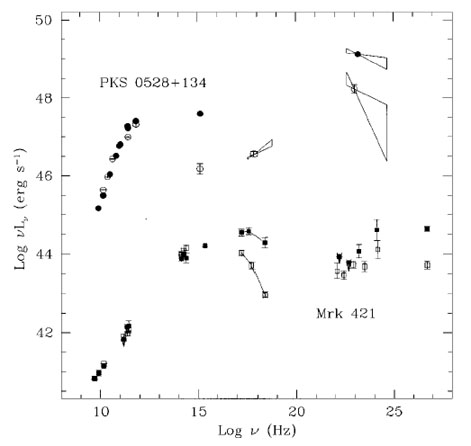
FIgure 7. Spectral energy distributions for two blazars in high and low states: Mrk 421 (filled and open squares) and PKS 0528+134 (filled and open circles). In both cases, the intensity is more highly variable above the peaks than below. [From Macomb et al (1995, 1996), Sambruna et al (1996).] The case of 3C 279 is illustrated in Maraschi et al (1994). |
The TeV power emitted by Mrk 421 (see Figure 7) dominates its bolometric luminosity, at least in the high state. Another nearby BL Lac object, Mrk 501 (also a modest EGRET source), has also been detected at TeV energies (Quinn et al 1996). Absorption by IR-optical photons locally or along the intergalactic path may prevent the detection of more distant blazars (Stecker et al 1996). Alternatively HBL, of which Mrk 421 is the brightest in the northern sky, may be intrinsically stronger TeV sources than LBL owing to the higher peak frequency of both spectral components (see Figures 6 and 7).
Some important conclusions can be drawn from the EGRET and Whipple discoveries. First, the gamma-ray emitting region must be transparent (i.e. the optical depth to pair production must be low), yet for minimal assumptions about ambient X-ray photon densities, the size limit imposed by the rapid gamma-ray variability implies very high optical depths. Therefore the gamma rays must be relativistically beamed (Maraschi et al 1992, Becker & Kafatos 1995, Dondi & Ghisellini 1995, Gaidos et al 1996).
Second, blazars emit a large fraction of their luminosity at very high energies. If the long-term gamma-ray light curve of 3C 279 is typical, even if the EGRET detections are biased toward exceptional states of gamma-ray activity, the "average" power output in gamma rays is comparable to that at all other wavelengths.
Third, the second peak of the spectral power distribution remarkably seems to fall at the highest energies for those objects whose first peak is also at high frequency: it probably lies near 0.1-1 GeV for LBL and 10-100 GeV for HBL (see Figure 7), although this is based on very incomplete data. A likely origin of the gamma-ray emission is Compton scattering of lower energy photons by the same relativistic electrons producing the low frequency component (Section 8.4). The correlation of variability at high and low frequencies is a crucial test for this class of models.