12. Figures
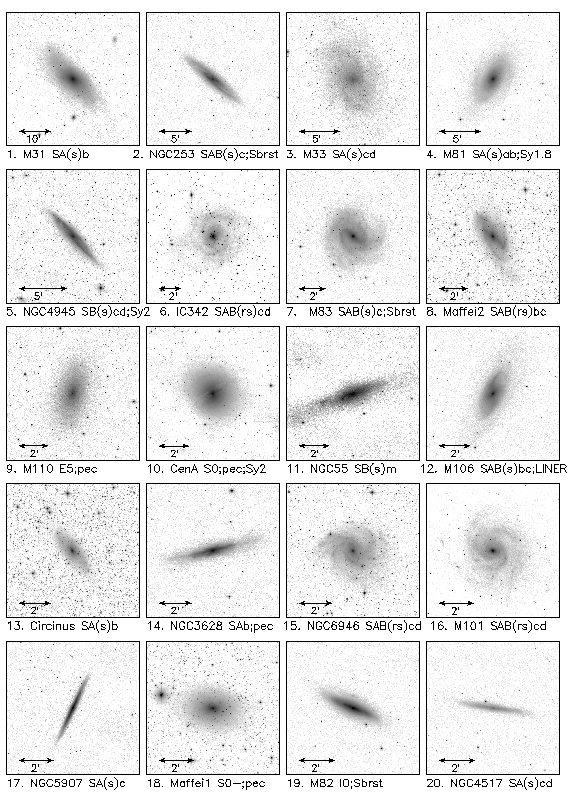
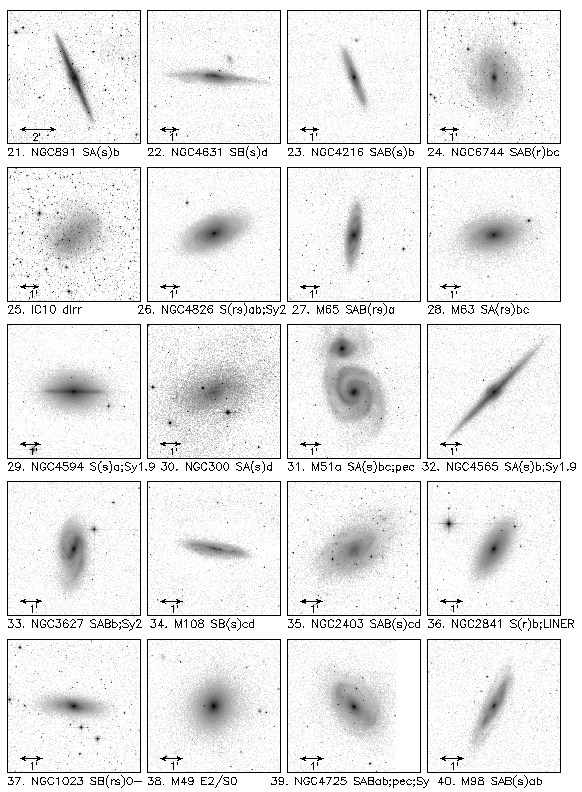
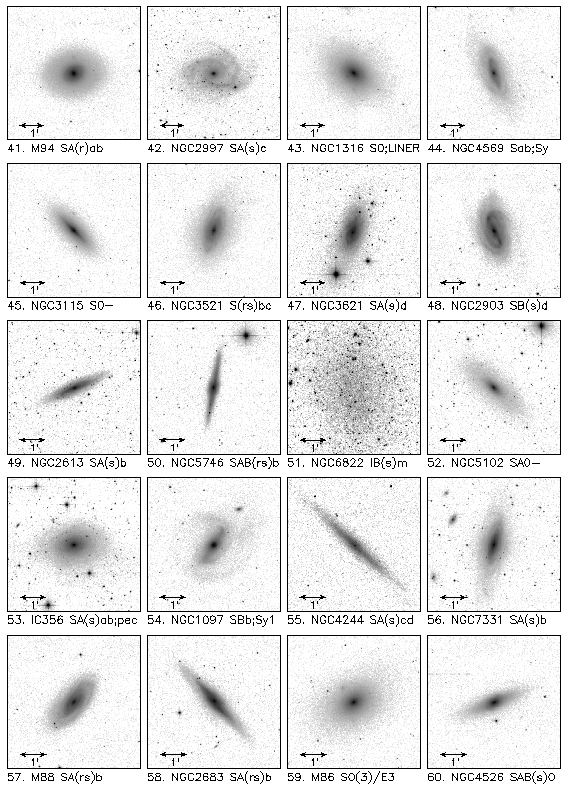
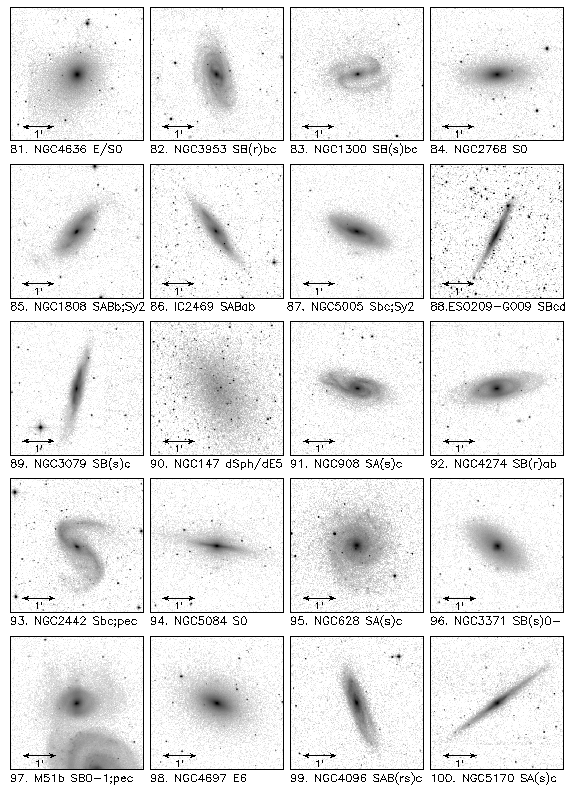
Figures 1-5.--2MASS mosaic images of the 100 largest galaxies in the near-infrared (1.1-2.3 µm). The black&white half-tone images represent the J+H+Ks "super" combination. The grey-scale is log-stretched using an algorithm that optimally enhances the low surface brightness features of the galaxy while maintaining high contrast in the nucleus (see Appendix for details). The name and NED (Hubble type/morphology) are also indicated. Larger, higher resolution versions of these images, including individual JHKs bands and 3-color combinations, can be found in NED and in IRSA.
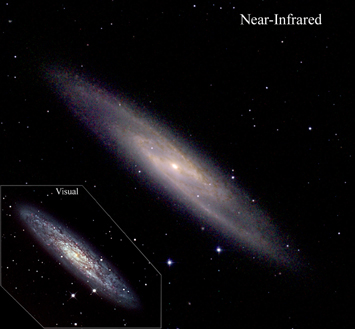
Figure 6.--Nearby starburst galaxy NGC 253 (VH =250 km/s). The upper panel shows the near-infrared mosaic of galaxy NGC 253, with 2MASS bands: J, H and Ks, RGB combined to form a full color image. The lower panel shows the galaxy as seen in the visual (blue to red) window. The 4-color photophaphic image was taken by amateur astronomer Tony Hallas using a 14.5" Cassegrain telescope. The field of view is ~20 arcmin.
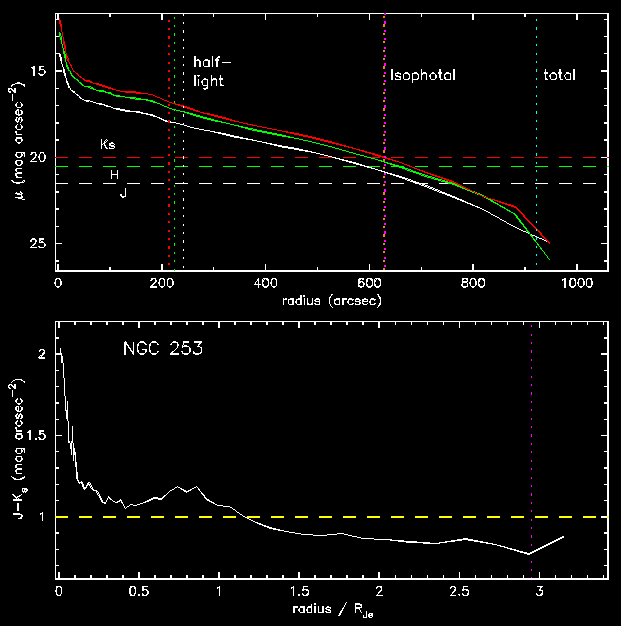
Figure 7.-- Radial surface brightness and color profile for NGC 253. The upper panel shows the median surface brightness (µ) distribution, in units of mag arcsec-2. The profiles are such that J-band is the brightest, followed by H-band, and finally Ks-band. The horizontal dashed lines represent the J-band, H-band and Ks-band 1-sigma background RMS noise, respectively (J-band being the faintest of the three). The vertical dotted line near r=242 arcsec corresponds to the J-band half-light radius, r=630 arcsec the isophotal radius, and r=920 arcsec the "total" radius. The lower panel shows the J-Ks color corresponding to the median surface brightness distribution. In order to combine galaxies of different sizes, the radius is normalized by the J-band half-light radius. The dashed line corresponding to J-Ks=1 mag represents the typical global color for 2MASS galaxies. The vertical dotted line corresponds to the isophotal radius.
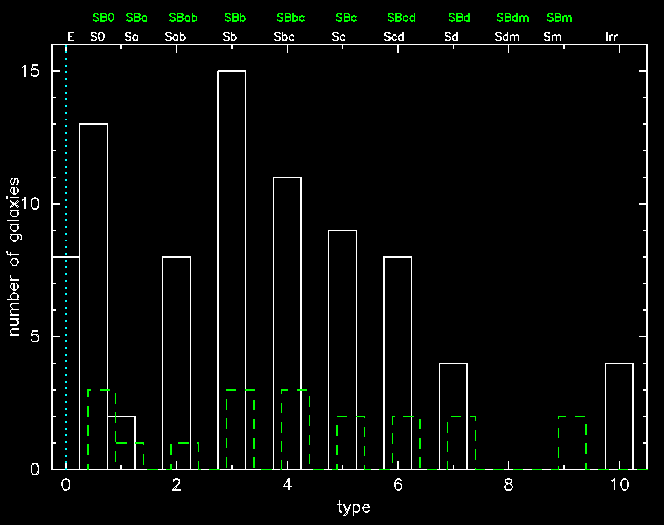
Figure 8.--Morphology histogram of the 100 largest galaxies. The "type" is an index that ranges from 0 to 9, from early-type to late-type galaxies (E, S0, Sa, Sab, Sb, Sbc, Sc, Scd, Sd, Sdm, Sm); solid histogram. Peculiar and irregular galaxies are arbitrarily assigned a type of 10. Lenticular galaxies (S0) are further delineated from E-types by assigning a T-type of 0.5 (i.e., between E and Sa). Barred-type galaxies (SB) are separated from normal galaxies (SA and SAB) by assigning a T-type that is slightly offset for viewing purposes (dashed histogram).
Figure 9.--Radial surface brightness profile fit parameters, alphta and beta. The scale length, alphta, has arcsecond units. The sources are coded according to their Hubble-type morphology. The large filled triangle corresponds to NGC 104 (globular cluster, "47 Tucana").
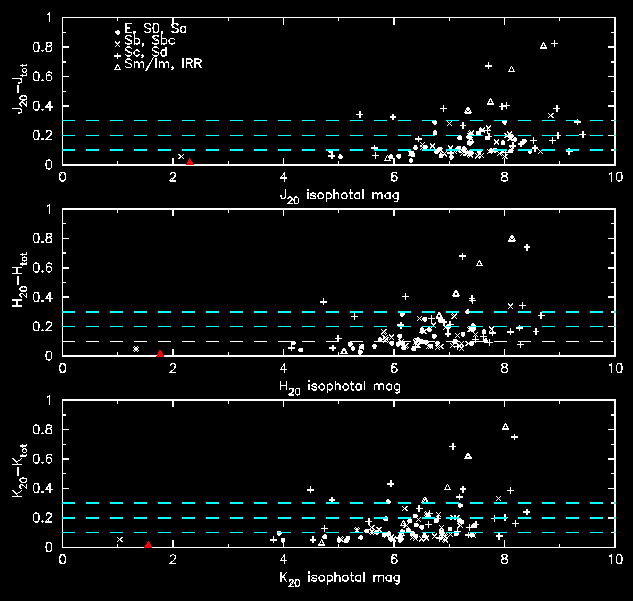
Figure 10.--Histogram of Ks-band isophotal mags for the 100 largest galaxies. The brightest source is M31.
Figure 11.--Isophotal vs. Total mags. The difference between the isophotal and "total" mag is compared to the isophotal mag. The sources are coded according to their morphology. The large filled triangle corresponds to NGC 104 (globular cluster, "47 Tucana").
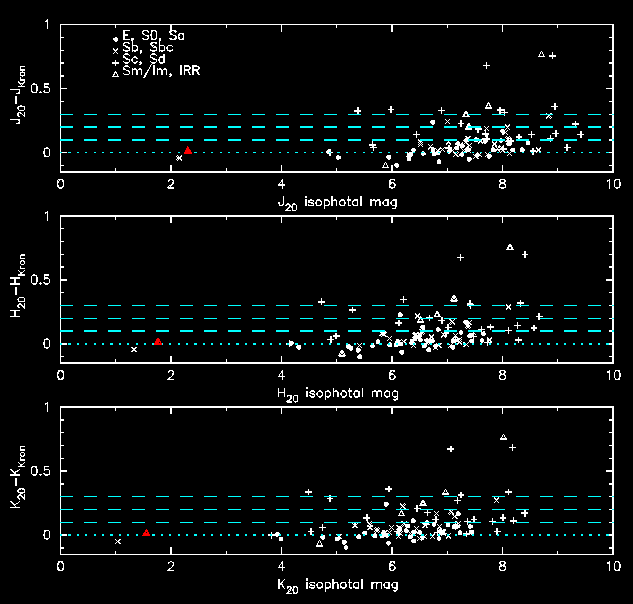
Figure 12.--Isophotal vs. Kron mags. The difference between the isophotal and Kron mag is compared to the isophotal mag. The sources are coded according to their morphology. The large filled triangle corresponds to NGC 104 (globular cluster, "47 Tucana").
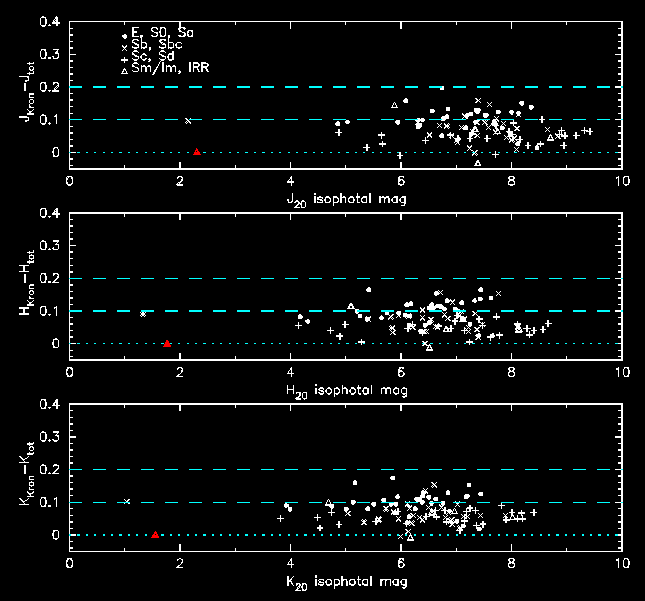
Figure 13.--Kron vs. Total mags. The difference between the Kron and "total" mag is compared to the Kron mag. The sources are coded according to their morphology. The large filled triangle corresponds to NGC 104 (globular cluster, "47 Tucana").
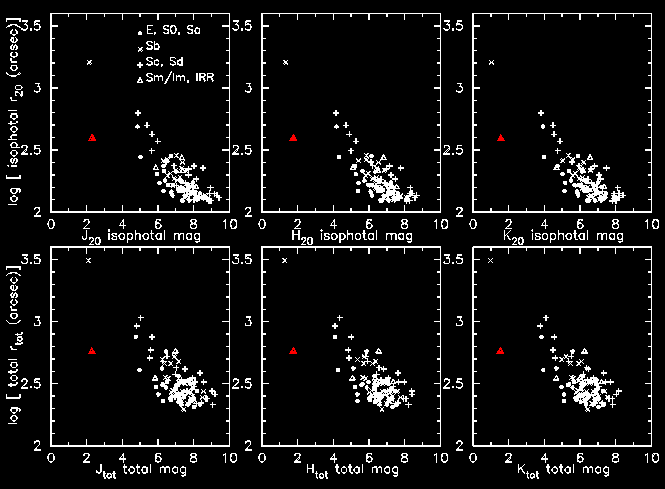
Figure 14.--Size versus integrated flux for the 100 largest galaxies. The upper panels show the isophotal radius vs. mag, and the lower panels the "total" radius vs. mag. The sources are coded according to their morphology. The large filled triangle corresponds to NGC 104 (globular cluster, "47 Tucana").
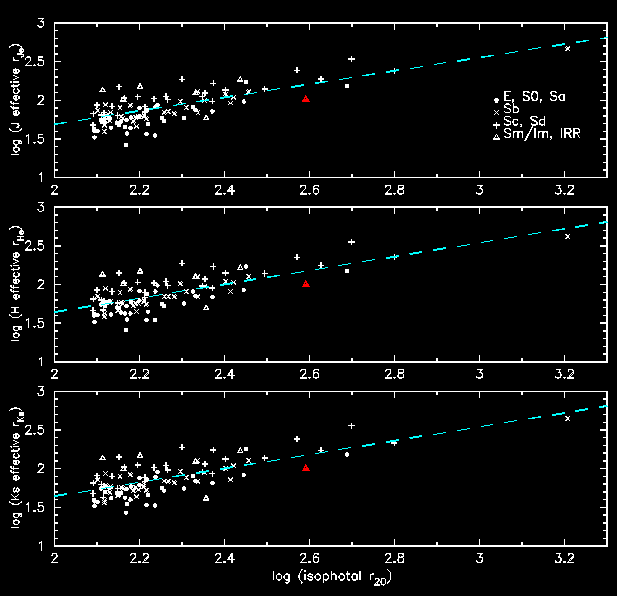
Figure 15.--Half-light radius as a function of the integrated flux. The "effective" or half-light radius is derived from the surface brightness profile and the "total" integrated flux of the galaxy. The dashed line represents a linear fit to the points. The sources are coded according to their morphology. The large filled triangle corresponds to NGC 104 (globular cluster, "47 Tucana").
Figure 16.--Near-infrared central surface brightness as a function of the integrated flux. The effective or central surface brightness, m, is derived from the half-light radius. The dashed line represents a linear fit to the points. The sources are coded according to their morphology. The large filled triangle corresponds to NGC 104 (globular cluster, "47 Tucana").
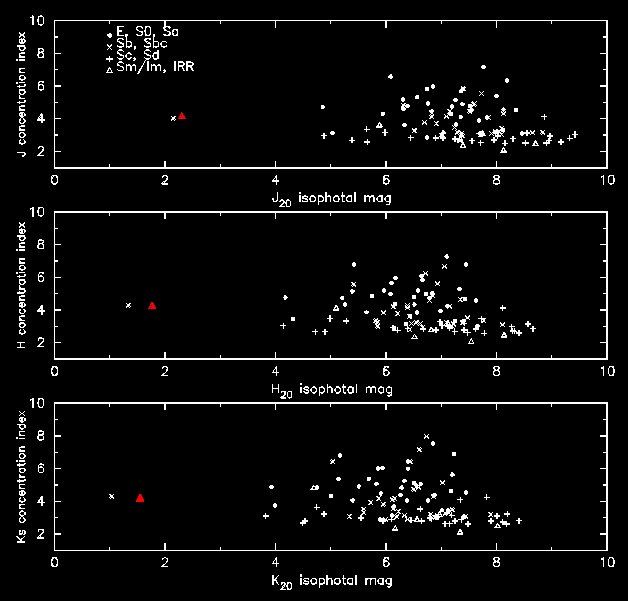
Figure 17.--Concentration index as a function of the integrated flux. The index is derived from the � and � light radii. The sources are coded according to their morphology. The large filled triangle corresponds to NGC 104 (globular cluster, "47 Tucana").
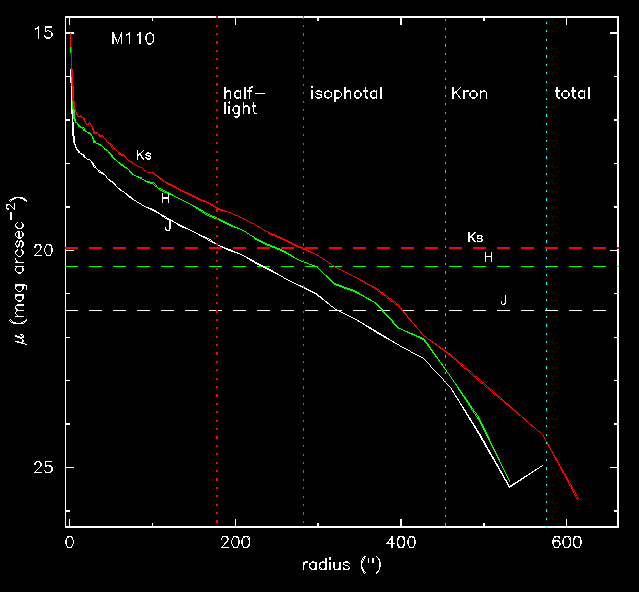
Figure 18.--Radial surface brightness profile for M110 (NGC 205). The surface brightness (µ) is in units of mag arcsec-2. The profiles are such that J-band is the brightest, followed by H-band, then Ks-band. The horizontal dashed lines represent the J-band, H-band and Ks-band 1-sigma background RMS noise, respectively (J-band the faintest limit). The vertical dotted line near r=170 arcsec corresponds to the Ks-band half-light radius, r=280 arcsec the Ks isophotal radius, and r=580 arcsec the "total" radius.
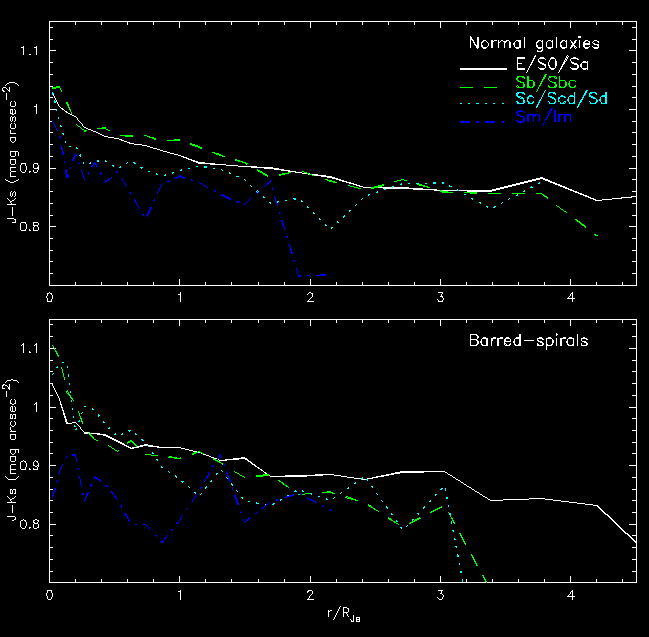
Figure 19.--NIR radial color distribution for the entire LGA sample. To show statistical trends, the entire Large Galaxy Atlas sample is used (to date, ~500 galaxies). The color distribution is derived from the radial surface brightness distribution for each galaxy (see for example, Figure 7). In order to combine galaxies of different sizes, the radius is normalized by the J-band half-light radius. The upper panel shows the binned mean J-Ks color vs. normalized radius for galaxies separated by their Hubble type. The lower panel shows the color distribution for barred galaxies.
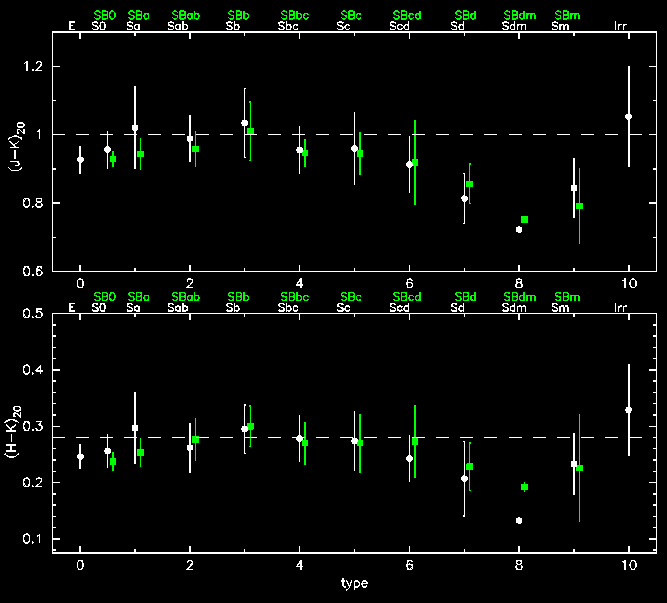
Figure 20.--NIR colors vs. type for the entire LGA sample. The upper panel shows the J-Ks color as derived from the isophotal mags. The lower panel shows the isophotal H-Ks mags. The filled circles denote normal galaxies and the filled squares "barred" galaxies. The errorbars represent RMS scatter in the color within the type group. See Figure 8 for explanation of the types.
Figure 21.--Half-light radius vs. type for the entire LGA sample. The filled circles denote normal galaxies and the filled squares "barred" galaxies. The errorbars represent RMS scatter in the radius within the type group. The large filled triangle corresponds to NGC 104 (globular cluster, "47 Tucana"). See Figure 8 for explanation of the T-types.
Figure 22.--Central Surface Brightness vs. type for the entire LGA sample. The filled circles denote normal galaxies and the filled squares "barred" galaxies. The errorbars represent RMS scatter in the radius within the type group. The large filled triangle corresponds to NGC 104 (globular cluster, "47 Tucana"). See Figure 8 for explanation of the types.
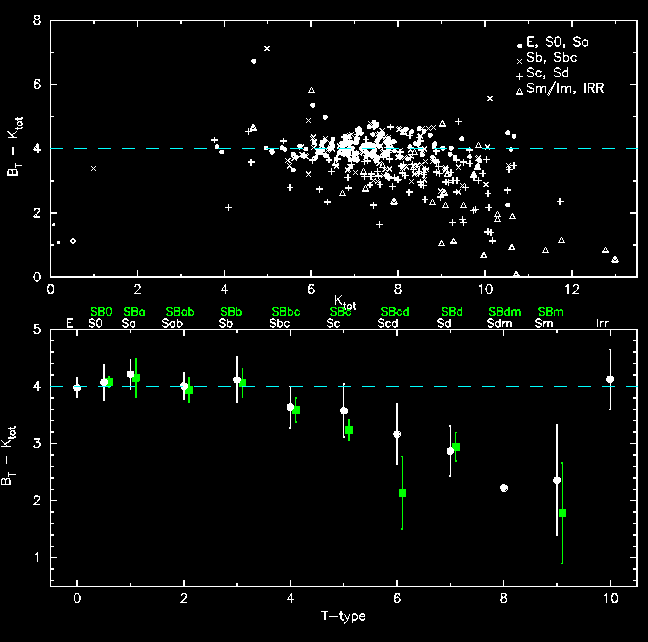
Figure 23.--Optical vs. NIR integrated flux for the entire LGA sample. The upper panel shows the B-K "total" color vs. the "total" Ks mag. The optical mags come from the RC3. The dashed line represents the average color for early-type galaxies (E and S0 types). The sources are coded according to their morphology. The lower panel shows the B-K color vs. type. The filled circles denote normal galaxies and the filled squares "barred" galaxies. The errorbars represent RMS scatter in the radius within the type group. See Figure 8 for explanation of the types. No reddening or inclination corrections are made.
Figure 24.--Optical vs. NIR diameters for the entire LGA sample. The upper panel shows the ratio of the Ks-band "total" diameter to the optical 25 mag arcsec-2 B-band isophotal diameter. The lower panel shows the ratio of Ks isophotal diameter to the optical diameter. The filled circles denote normal galaxies and the filled squares "barred" galaxies. The errorbars represent RMS scatter in the radius within the type group. See Figure 8 for explanation of the types.
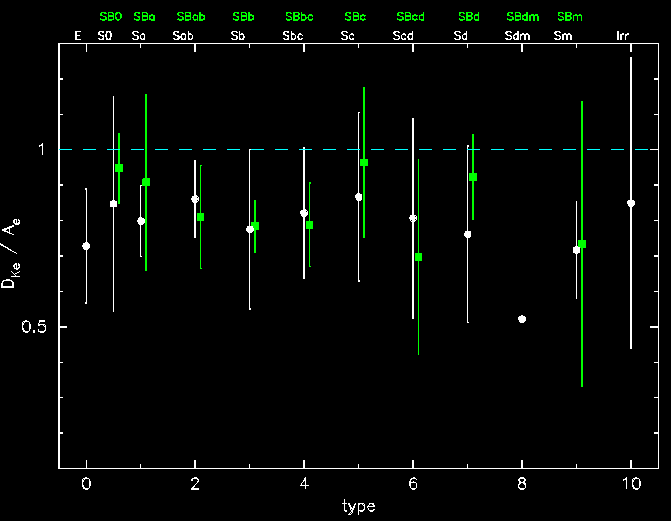
Figure 25.--Optical vs. NIR half-light radii for the entire LGA sample. The optical half-light "effective" diameter, Ae, comes from the RC3. The filled circles denote normal galaxies and the filled squares "barred" galaxies. The errorbars represent RMS scatter in the radius within the type group. See Figure 8 for explanation of the types.
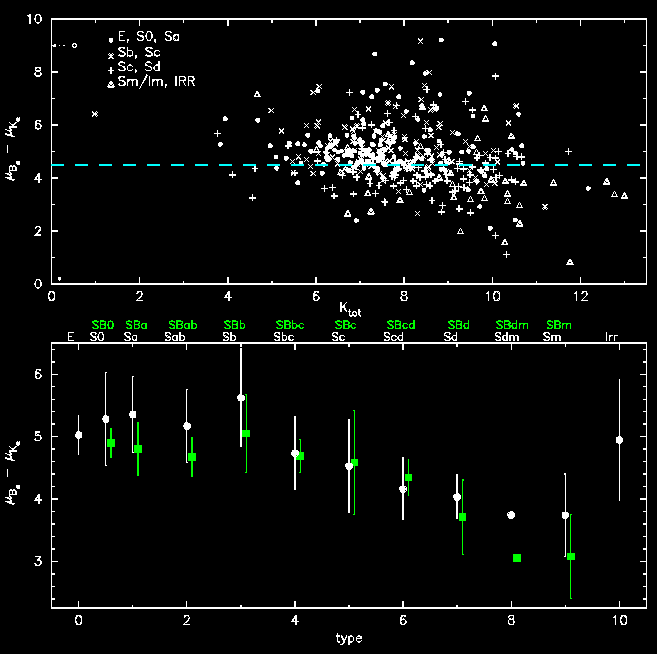
Figure 26.--Optical vs. NIR surface brightness for the entire LGA sample. The B-band surface brightness, µe, is computed from the RC3 "effective" diameter, Ae. The dashed line corresponds to the average surface brightness color for early-type galaxies (E, S0, Sa). The filled circles denote normal galaxies and the filled squares "barred" galaxies. The errorbars represent RMS scatter in the radius within the type group. See Figure 8 for explanation of the T-types.

Figure 27.-- The Whirpool Galaxy (M51, NGC 5194/95) as seen in the near-infrared and mid-infrared wavelengths. The 2MASS near-infrared images J (1.2 µm) and Ks (2.2. µm) are shown with the blue and green channels, respectively (see also Fig. 1, panel 31, for the black and white version of the near-infrared images). The ISOCAM LW2 (6.5 µm) image is shown with the red channel. The 2MASS images were smoothed to a beam resolution of 7 arcsec, corresponding to the ISOCAM resolution. The image is rotated roughly 54 degrees east of north, corresponding to the original spacecraft orientation during the M51 observations. Stars have been removed from the ISOCAM image. The field of view is ~8.8* 9.9 arcmin. We employ the modified logarithmic visualization method (Appendix) to enhance the low surface brightness features of M51.