Copyright © 1998 by Annual Reviews. All rights reserved
| Annu. Rev. Astron. Astrophys. 1998. 36:
189-231 Copyright © 1998 by Annual Reviews. All rights reserved |


The observations described above can be fitted together into a coherent evolutionary picture of disk galaxies and the Hubble sequence. This section summarizes the evolutionary implications of these data, taking into account the distinct patterns seen in the disks and galactic nuclei. It concludes with a discussion of the critical role of the interstellar gas supply in regulating the SFR, across the entire range of galaxy types and environments.
5.1. Disk Evolution Along the Hubble Sequence
The strong trends observed in the SFR per unit of luminosity along the
Hubble sequence mirror underlying trends in past star formation
histories of disks
(Roberts 1963,
Kennicutt 1983a,
Gallagher et al 1984,
Sandage 1986,
Kennicutt et al 1994).
A useful parameter for characterizing
the star formation histories is the ratio of the current SFR to the
past SFR averaged over the age of the disk, denoted b
by Scalo (1986).
The evolutionary synthesis models discussed in
Section 2 provide relations
between b and the broadband colors and
H EWs.
Figure 3
shows the distribution of b (right axis scale) for an
H-selected
sample of galaxies, based on the calibration of
Kennicutt et al (1994).
The typical late-type spiral has formed stars at
a roughly constant rate (b ~ 1), which is consistent with direct
measurements of the stellar age distribution in the Galactic disk
(e.g. Scalo 1986).
By contrast, early-type spiral galaxies are characterized
by rapidly declining SFRs, with b ~ 0.01-0.1, whereas elliptical
and S0 galaxies have essentially ceased forming stars (b =
0). Although the values of b given above are based solely on
synthesis modeling of the
H equivalent widths,
analysis of the integrated
colors and spectra of disks yield similar results (e.g.
Kennicutt 1983a,
Gallagher et al 1984,
Bruzual & Charlot
1993,
Kennicutt et al 1994).
EWs.
Figure 3
shows the distribution of b (right axis scale) for an
H-selected
sample of galaxies, based on the calibration of
Kennicutt et al (1994).
The typical late-type spiral has formed stars at
a roughly constant rate (b ~ 1), which is consistent with direct
measurements of the stellar age distribution in the Galactic disk
(e.g. Scalo 1986).
By contrast, early-type spiral galaxies are characterized
by rapidly declining SFRs, with b ~ 0.01-0.1, whereas elliptical
and S0 galaxies have essentially ceased forming stars (b =
0). Although the values of b given above are based solely on
synthesis modeling of the
H equivalent widths,
analysis of the integrated
colors and spectra of disks yield similar results (e.g.
Kennicutt 1983a,
Gallagher et al 1984,
Bruzual & Charlot
1993,
Kennicutt et al 1994).
The trends in b shown
in Figure 3 are based on integrated
measurements,
so they are affected by bulge and nuclear contamination, which bias
the trends seen along the Hubble sequence. A more detailed analysis by
Kennicutt et al (1994)
includes corrections for bulge contamination
on the H EWs.
The mean value of b (for the disks alone) increases
from < 0.07 for Sa disks to 0.3 for Sb disks and 1.0 for Sc disks.
This change is much larger than the change in bulge mass fraction over
the same range of galaxy types, implying that most of the variation in
the integrated photometric properties of spiral galaxies is produced by
changes in the star formation histories of the disks, not in the
bulge-to-disk ratio. Variations in bulge-disk structure may play an
important role, however, in physically driving the evolution of the
disks.
As discussed earlier, this picture has been challenged by Devereux & Hameed (1997), based on the much weaker variation in FIR luminosities along the Hubble sequence. The results of the previous section provide part of the resolution to this paradox. Many early-type barred spirals harbor luminous circumnuclear starbursts, with integrated SFRs that can be as high as the disk SFRs in late-type galaxies. If this nuclear star formation is included, then the interpretation of the Hubble sequence given above is clearly oversimplistic. For that reason, it is important to delineate between the the nuclear regions and more extended disks when characterizing the evolutionary properties of galaxies. Much of the remaining difference in interpretations hinges on the nature of the FIR emission in early-type galaxies, which may not directly trace the SFR in all galaxies.
Although Figure 3 shows a strong change in the average star formation history with galaxy type, it also shows a large dispersion in b among galaxies of the same type. Some of this must be due to real long-term variations in star formation history, reflecting the crudeness of the Hubble classification itself. Similar ranges are seen in the gas contents (Roberts & Haynes 1994), and these correlate roughly with the SFR and b variations (Figure 5). Short-term variations in the SFR can also explain part of the dispersion in b. Nuclear starbursts clearly play a role in some galaxies, especially early-type barred galaxies, and interaction-induced starbursts are observed in a small percentage of nearby galaxies. Starbursts are thought to be an important, if not dominant, mode of star formation in low-mass galaxies (e.g. Hunter & Gallagher 1985, Hodge 1989, Ellis 1997), but the role of large-scale starbursts in massive galaxies is less well established (Bothun 1990, Kennicutt et al 1994, Tomita et al 1996). A definitive answer to this question will probably come from look-back studies of large samples of disk galaxies.
A schematic illustration of the trends in star formation histories is shown in Figure 8. The left panel compares the stellar birthrate histories of typical elliptical galaxies (and spiral bulges) and the disks of Sa, Sb, and Sc galaxies, following Sandage (1986). The curves for the spiral disks are exponential functions that correspond to the average values of b from Kennicutt et al (1994). For illustrative purposes, an exponentially declining SFR with an e-folding time scale of 0.5 Gyr is also shown, as might be appropriate for an old spheroidal population. In this simple picture, the Hubble sequence is primarily dictated by the characteristic time scale for star formation. In the more contemporary hierarchical pictures of galaxy formation, these smooth histories would be punctuated by merger-induced starbursts, but the basic long-term histories would be similar, especially for the disks.
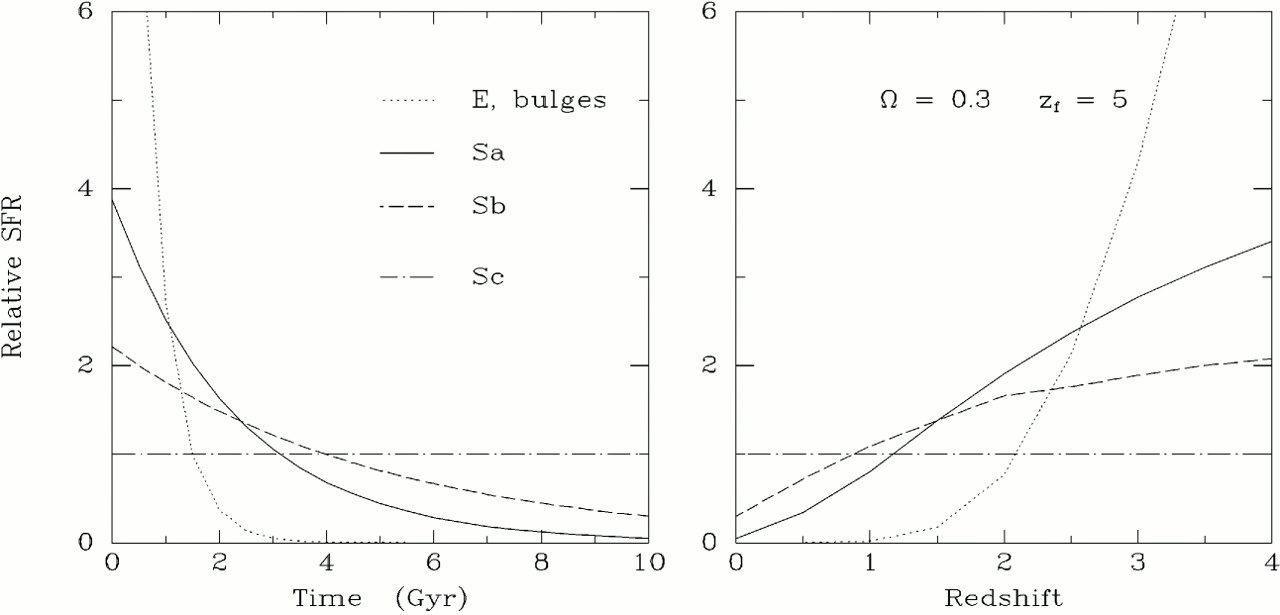 |
Figure 8. A schematic illustration of the
evolution of the stellar birthrate
for different Hubble types. The left panel shows
the evolution of the relative SFR with time, following
Sandage (1986).
The curves for spiral galaxies are exponentially declining SFRs that
fit the mean values of the birthrate parameter b
measured by
Kennicutt et al
(1994). The curve
for elliptical galaxies and bulges is an arbitrary dependence for an
e-folding time of 0.5 Gyr, for comparative purposes only. The right
panel shows the corresponding evolution in SFR with redshift, for
an assumed cosmological density parameter
|
The right panel in
Figure 8 shows the same star formation histories
but transformed into SFRs as functions of redshift (assuming
 = 0.3 and
a formation redshift zf = 5). This diagram illustrates
how the dominant
star forming (massive) host galaxy populations might evolve with redshift.
Most star formation at the present epoch resides in late-type gas-rich
galaxies, but by z ~ 1, all spiral types are predicted to have
comparable SFRs, and
(present-day) early-type systems become increasingly dominant at higher
redshifts. The tendency of early-type galaxies to have higher masses
will make the change in population with redshift even stronger. It will be
interesting to see whether these trends are observed in future look-back
studies. Many readers are probably aware that the redshift dependence of the
volume averaged SFR shows quite a different character, with a broad
maximum between z ~ 1-2 and a decline at higher redshifts
(Madau et al 1996,
1998).
This difference probably reflects the importance
of hierarchical processes such as mergers in the evolution of galaxies,
mechanisms that are not included in the simple phenomenological description
in Figure 8
(Pei & Fall 1995,
Madau et al 1998).
= 0.3 and
a formation redshift zf = 5). This diagram illustrates
how the dominant
star forming (massive) host galaxy populations might evolve with redshift.
Most star formation at the present epoch resides in late-type gas-rich
galaxies, but by z ~ 1, all spiral types are predicted to have
comparable SFRs, and
(present-day) early-type systems become increasingly dominant at higher
redshifts. The tendency of early-type galaxies to have higher masses
will make the change in population with redshift even stronger. It will be
interesting to see whether these trends are observed in future look-back
studies. Many readers are probably aware that the redshift dependence of the
volume averaged SFR shows quite a different character, with a broad
maximum between z ~ 1-2 and a decline at higher redshifts
(Madau et al 1996,
1998).
This difference probably reflects the importance
of hierarchical processes such as mergers in the evolution of galaxies,
mechanisms that are not included in the simple phenomenological description
in Figure 8
(Pei & Fall 1995,
Madau et al 1998).