


4.8. Conclusions
This section leads to two observational conclusions. First
(Fig. 9): Besides true exponential disks and
Freeman (1970)
Type II exponentials,
some disks have steeper density profiles near the center than the
inward extrapolation of an exponential fitted at large r. Disks
can even have r1/4 - law central brightness
profiles, in which case they
are indistinguishable from bulges on the basis of density or density
gradient alone. They can often be recognized by
Vmax /  values that are larger than normal for isotropic spheroids of the
observed
values that are larger than normal for isotropic spheroids of the
observed  (however,
see section 6). I do not mean to imply
that there is no bulge at all in all of these galaxies; at least at
early Hubble types, the high-density disk material has probably been
added to a preexisting bulge. But in extreme cases, the disk dominates
the projected density.
(however,
see section 6). I do not mean to imply
that there is no bulge at all in all of these galaxies; at least at
early Hubble types, the high-density disk material has probably been
added to a preexisting bulge. But in extreme cases, the disk dominates
the projected density.
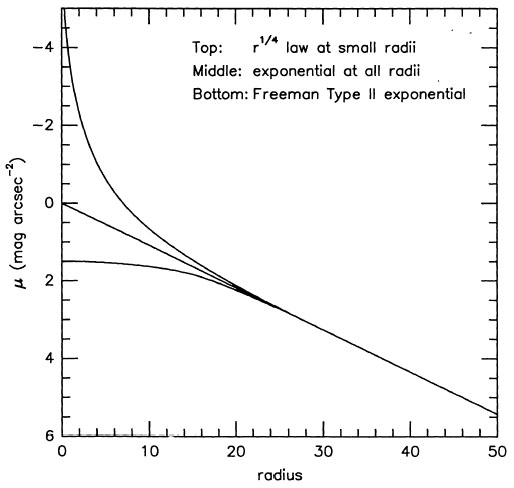 |
Figure 9. Schematic disk brightness profiles. |
Second (Fig. 10): If we want B/T to measure the true bulge-to-total luminosity ratio, i.e., the fraction of the total light that is contributed by an ellipsoidal component that is more-or-less like an elliptical galaxy, then the true distribution of bulge-to-total luminosity ratios is skewed toward smaller values than those we derive from a blind decomposition of luminosity distributions into r1/4 - law and exponential parts. At all Hubble types, this effect is most common in barred and oval galaxies. Otherwise, it is smallest at early Hubble types, where most bulges are like ellipticals (except in some S0s). At type Sb, there are already some galaxies in which most of the "bulge" is really disk material, although others (e.g., M 31 and M 81) contain true bulges. By type Sc, I do not believe that any galaxies contain true bulges.
 |
Figure 10. Schematic distributions of true bulge-to-total luminosity ratios. This figure is adapted from Fig. 2 in Simien and de Vaucouleurs (1986); Eb, Ee, and Ed refer to ellipticals with boxy, elliptical, and disky isophotes, respectively. The points are values measured by decomposing profiles into r1/4-law and exponential parts. The curves estimate how the boundaries of the B/T distributions change if we include disk-like "bulges" with disks. More accurate B/T distributions should ultimately be based on dynamical data. |