


4.1. Faraday Rotation Measures
Faraday rotation measures (RMs) where available are given in Table 5. There are many sources in the complete samples without measured RMs. Note that it is often difficult to measure reliable RMs in GPS sources for the following reasons. (1) The polarization is so low that it is often difficult to detect polarization at multiple wavelengths. (2) The existing observations tend to straddle the peak of the spectrum, so that (assuming the turnover is due to synchrotron self-absorption) the wavelength dependence of the polarization is contaminated by the effects of synchrotron opacity. Polarization measurements at high frequencies above the spectral peak are needed to determine if GPS sources generally have high RMs.
| RM | RM(1 + z)2 | ||||
| IAU Name | Catalog Name | Class | (rad m-2) | (rad m-2) | References |
| (1) | (2) | (3) | (4) | (5) | (6) |
| 0127+23 | 3C43 | CSS | -65 | -393 | 1 |
| 0134+32 | 3C48 | CSS | -67 | -126 | 2 |
| 0221+27 | 3C67 | CSS | -64 | -110 | 1 |
| 0237-233 | OD-263 | GPS | 19 | 195 | 3 |
| 0248+430 | GPS | 44 | 236 | 3 | |
| 0319+121 | GPS | -15 | -202 | 1 | |
| 0429+41 | 3C119 | CSS | 1728 | 3400 | 4 |
| 0457+024 | GPS | 258 | 2954 | 5 | |
| 0500+019 | OG 003 | GPS | -7 | -18 | 1 |
| 0518+16 | 3C138 | CSS | -2 | -22 | 1 |
| 0538+49 | 3C147 | CSS | -1510 | -3150 | 4 |
| 0552+398 | GPS | -658 | 4446 | 6 | |
| 0658+38 | 3C173 | CSS | -11 | -46 | 1 |
| 0738+313 | GPS | -813 | -2160 | 5 | |
| 0802+10 | 3C191 | CSS | 89 | 778 | 1 |
| 0941-08 | GPS | 35 | 53 | 1 | |
| 1005+07 | 3C237 | CSS | 141 | 497 | 1 |
| 1019+22 | 3C241 | CSS | 18 | 123 | 1 |
| 1117+146 | 4C14.41 | GPS | -112 | 208 | 1 |
| 1127-145 | GPS | 33 | 158 | 1 | |
| 1143-245 | GPS | 146 | 1270 | 5 | |
| 1203+64 | 3C268.3 | CSS | 86 | 161 | 1 |
| 1245-197 | GPS | 942 | 4875 | 7 | |
| 1354-17 | OP-190.4 | GPS | -29 | -499 | 1 |
| 1328+25 | 3C287 | CSS | -58 | -245 | 1 |
| 1328+30 | 3C286 | CSS | -1 | -3 | 2 |
| 1442+101 | OQ172 | GPS | 1091 | 22400 | 4,8 |
| 1447+77 | 3C305.1 | CSS | -57 | -259 | 1 |
| 1458+71 | 3C309.1 | CSS | 63 | 228 | 1 |
| 1517+20 | 3C318 | CSS | 456 | 1400 | 8 |
| 1641+17 | 3C346 | CSS | -32 | -43 | 1 |
| 2223+21 | GPS | -125 | -1094 | 1 | |
| 2134+004 | GPS | 349 | 3008 | 5 | |
| 2247+14 | 4C14.82 | CSS | -3 | -5 | 1 |
| 2248+71 | 3C454.1 | CSS | -49 | -395 | 1 |
| 2249+18 | 3C454 | CSS | -87 | -661 | 1 |
| 2252+12 | 3C455 | CSS | 7 | 17 | 1 |
NOTES. - A compilation of Faraday
Rotation Measures for GPS and CSS sources which are listed in
Table 1.
Columns: (1), IAU Name; (2), catalog name; (3), class (either CSS or GPS);
(4), Observed RM; (5), RM in the rest frame of the source; (6), A reference
for the observed RM.
Note that the high RM for 0201+113 in O'Dea et al. (1990) was not confirmed
by Stanghellini et al. (1997c).
| |||||
Saikia, Swarup, &
Kodali (1985)
suggested that the RMs of CSS sources tend to be slightly higher than
those of large-scale 3CR sources. Since then, examples of GPS/CSS
sources with extreme values of RM
( 1000 rad
m-2 in the source rest frame) have been found
(Kato et al. 1987;
Aizu et al. 1990;
Taylor, Inoue, &
Tabara 1992;
Inoue et al. 1995).
Note, however, that there are also GPS/CSS sources with small
measured values of RM.
Lüdke et al. (1996)
show that the CSS and large FR 2 sources display a trend of increasing
Faraday dispersion with decreasing source size.
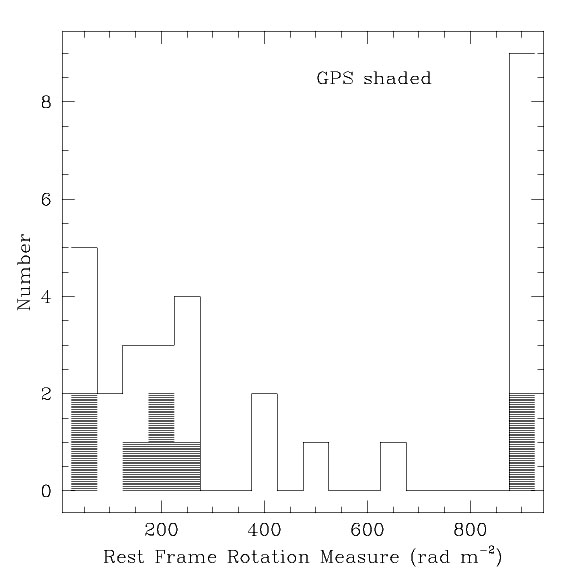
Table 5 lists 11 sources with rest-frame RM
1000 rad
m-2. Figure 7 shows that (1) GPS and CSS
sources have similar RMs; (2) there is a large range of RMs, possibly
divided into three groups, small (RM
1000 rad
m-2 in the source rest frame) have been found
(Kato et al. 1987;
Aizu et al. 1990;
Taylor, Inoue, &
Tabara 1992;
Inoue et al. 1995).
Note, however, that there are also GPS/CSS sources with small
measured values of RM.
Lüdke et al. (1996)
show that the CSS and large FR 2 sources display a trend of increasing
Faraday dispersion with decreasing source size.
Table 5 lists 11 sources with rest-frame RM
1000 rad
m-2. Figure 7 shows that (1) GPS and CSS
sources have similar RMs; (2) there is a large range of RMs, possibly
divided into three groups, small (RM
 100),
intermediate (RM ~ 200), and large (RM
1000); and (3)
there is an upper envelope to the RM (defined mainly by the quasars)
that decreases with increasing projected linear size (consistent with
Lüdke et al.). Curiously, the quasars have a broader range in RM
than the galaxies; the sources with the smallest and largest values are
quasars.
100),
intermediate (RM ~ 200), and large (RM
1000); and (3)
there is an upper envelope to the RM (defined mainly by the quasars)
that decreases with increasing projected linear size (consistent with
Lüdke et al.). Curiously, the quasars have a broader range in RM
than the galaxies; the sources with the smallest and largest values are
quasars.
 |
 |
Figure 7. (a) Histogram of
rest-frame Faraday rotation measure for the subset with measurements of
the Fanti et al. CSS sample and the Stanghellini et al. GPS sample
(shaded). Sources in the rightmost bin have values
|
Currently, there are two classes of extragalactic radio sources that are found to have high RMs: GPS/CSS sources and radio galaxies at the centers of cluster cooling flows (Perley 1990; Taylor et al. 1992; Ge & Owen 1994). The high RMs in the cooling flow radio galaxies are thought to be produced in the intracluster medium (ICM) surrounding the radio galaxy. The inflowing cluster gas may compress, amplify, and radially align the intracluster magnetic field (Soker & Sarazin 1990), resulting in large Faraday depths. This raises the question of whether the GPS/CSS sources with high RMs are also in cooling flow clusters or whether the high RMs are produced in some other way, e.g., via interactions between the radio jet and the ambient medium.
The possible relationship between GPS/CSS sources and cooling flows
should be investigated. At present, there is only mixed anecdotal evidence.
O'Dea et al. (1994a)
noted that PKS 2322-123, which is in the center of a large
cooling flow in Abell 2597, is similar to many CSS sources and could
be considered to be a low-redshift example of a CSS source.
Forbes et al. (1990)
argue that 3C 309.1 has a massive cooling flow based on
pressures in the optical emission-line nebula. On the other hand,
O'Dea et al. (1996b)
used ROSAT observations to rule out a cooling flow greater than 3
M yr-1 in the GPS galaxies 1345+125 and 2352+495 (see
section 9).
yr-1 in the GPS galaxies 1345+125 and 2352+495 (see
section 9).
Recent VLBA polarimetry observations have clarified the location of the
high RMs in the CSS quasars OQ 172
(Taylor et al. 1996b;
cf. Udomprasert et
al. 1997)
and 3C 138
(Cotton et al. 1997a).
OQ 172 has a very large rest-frame RM
2 ×
104 rad m-2 measured in its integrated
polarization. Taylor et al. find that the high RM is confined to the
nuclear region of the quasar, and that over a scale of about 50 pc
(projected) the RM in the jet drops below 100 m-2. Similar
results (i.e., very high RM near the core, much lower farther out) are
found for 3C 138
(Cotton et al. 1997a).
This suggests that the high RM is produced in the nuclear environment of
the quasar and not in a cluster cooling flow. Thus, the high-RM
phenomenon depends sensitively on the source structure and
resolution.
What conditions in the ambient medium would produce RMs of order 103 rad m-2? For a uniform medium
 |
(5) |
where RM is the intrinsic RM in rad m-2, ne is the electron density in cm-3, B|| is the parallel component of the magnetic field in µG, and L is the path length in pc. For a path length of 100 pc, and a magnetic field of 10 µG in the ambient medium, the electron density is of order unity:
 |
(6) |
This calculation is meant to be merely illustrative; however, it does
suggest that electron densities in the environment of GPS/CSS sources
with large RMs could be very high. If the ambient medium has a low
ionization fraction (f), then the ambient density is
proportionally larger (nH  ne / f). Thus, at this point the existence
of large RMs in some CSS/GPS sources supports the hypothesis of a dense
ambient medium surrounding the radio source. Note that if the high RMs
turn out to be produced mainly in the nuclei, then this support will be
diminished.
ne / f). Thus, at this point the existence
of large RMs in some CSS/GPS sources supports the hypothesis of a dense
ambient medium surrounding the radio source. Note that if the high RMs
turn out to be produced mainly in the nuclei, then this support will be
diminished.