


Two examples of X-ray emission from clusters of galaxies are shown in Figs. 1 and 2. The cluster RBS797 (Fig. 1) has a very regular shape on this scale with a somewhat elongated structure. This is a typical relaxed cluster. The cluster CL0939+4713 (Fig. 2) has a very different, irregular morphology. In the XMM image one can distinguish clearly two main subclusters. These subclusters show even some internal structure. Obviously the cluster is not in an equilibrium state, but there are still some structures visible that are in the process of falling into the cluster. So already the X-ray morphology contains a lot of information about the dynamical state of the cluster. But X-ray spectroscopy tells even more. In Fig. 3 the temperature distribution of the gas in CL0939+4713 is shown. There is a hot region between the two subclusters which is an indication that the subclusters are approaching each other - just as it is expected from hydrodynamic simulations (Schindler & Müller 1993; Ricker & Sarazin 2001; Ritchie & Thomas 2002): when two subclusters start to merge the gas between them is compressed and heated, so that a hot region is produced. Therefore we conclude that this cluster in the beginning of a major merger process (De Filippis et al. 2002).
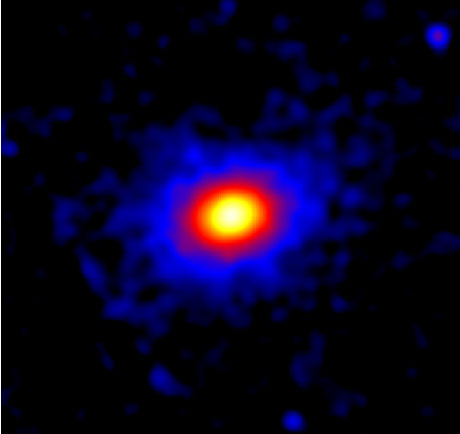 |
Figure 1. CHANDRA image of the cluster RBS797 (from Schindler et al. 2001). The cluster looks well virialised with a very regular surface brightness distribution. |
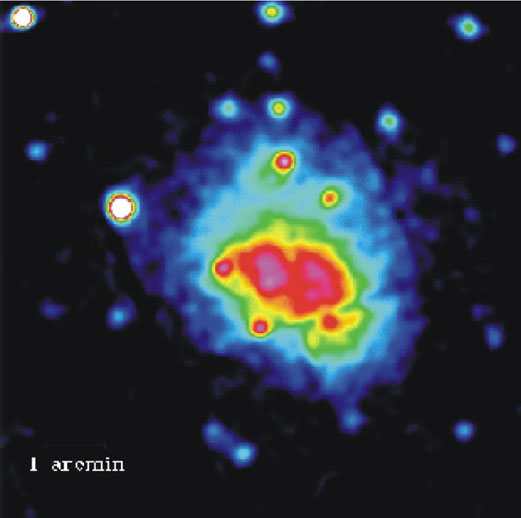 |
Figure 2. XMM image of the cluster CL0939+4713 (from De Filippis et al. 2002). Two subclusters are visible with even some internal structure indicating that the cluster is in a merger process. |
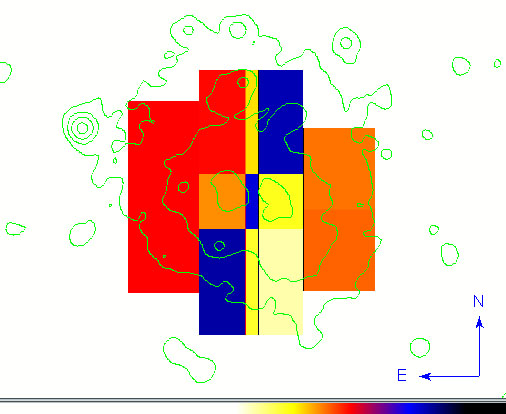 |
Figure 3. Temperature map of the cluster CL0939+4713 (from De Filippis et al. 2002). The temperature is increasing from yellow over orange and red to blue. The contours show the same surface brightness distribution as in Fig. 2. Between the two subclusters a region of hot gas is visible indicating that the subclusters are approaching each other. |
Also groups show extended emission coming from the IGM as it can be seen e.g. in HCG16 (Belsole et al. 2002) or in HCG90 (Longo et al. 2002). In groups the extended emission from the IGM is not so dominant as in clusters. One can usually see different components in the X-ray emission. Apart from the extended IGM also more compact components caused by galaxies and other sources can be seen.
The mass of the ICM and IGM is not negligible compared to the other components. Table 2 gives an overview of the mass fraction of gas, galaxies and dark matter in groups and clusters, respectively. In clusters there is always considerable more mass in the gas than in the galaxies, while in groups the mass in the galaxies usually exceeds the mass in the gas. Both systems have in common that most of the mass is in form of dark matter. This shows how important mass determination is. When the total mass of the system can be measured and the visible components are subtracted, the amount and distribution of the dark matter can be inferred.
| Clusters | Groups | |
| Galaxies | 3-5% | 3-20% |
| Gas | 15-20% | 2-10% |
| Dark matter | rest | rest |
There are different ways to determine masses, one of them is the X-ray method. With two assumptions - spherical symmetry and hydrostatic equilibrium - the X-ray emitting gas can be used as a tracer for the total potential. Only the gas density and the gas temperature are required for this method, which can both be measured from X-ray observations.
With the gas density also the gas mass is known. The ratio between gas mass and total mass is the gas mass fraction. In Fig. 4 the gas mass fraction is plotted versus the radius. We find that the gas mass fraction is not constant but is increasing with radius (Schindler 1999; Castillo-Morales & Schindler 2002) . That means that the gas is more extended than the dark matter. Obviously, there is not only gravitational energy from the collapse present but there must be additional heating processes at work like e.g. supernova-driven winds. Also interesting is the question whether the gas mass fraction is changing with time. In Fig. 5 the gas mass fraction is shown for nearby and distant cluster samples. So far no significant evolution is detectable.
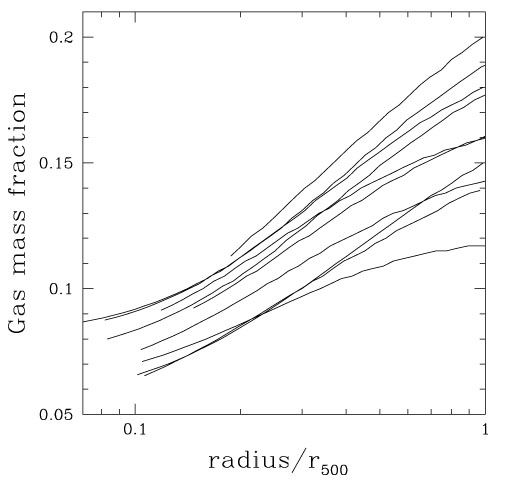 |
Figure 4. Gas mass fraction versus radius. For all the clusters the gas mass fraction increases with radius, i.e. the gas distribution is more extended than the dark matter distribution (from Castillo-Morales & Schindler 2002). |
 |
Figure 5. Gas mass fraction versus redshift. With the current data not significant evolution of the gas mass fraction in clusters is visible (from Castillo-Morales & Schindler 2002). |
The gas mass fraction can also be used to derive an upper limit on
the matter density of the universe
 m.
Assuming that the
matter accumulated in a cluster is representative for the universe
as a whole, the ratio between the mass in baryons and the total
mass Mgas / Mtot
m.
Assuming that the
matter accumulated in a cluster is representative for the universe
as a whole, the ratio between the mass in baryons and the total
mass Mgas / Mtot
 fgas should be the same as
baryon /
m. As an
upper limit for
baryon
can be determined
from primordial nucleosynthesis to be about 0.06 (for
H0 = 50 km/s/Mpc) one finds
m
0.3 - 0.4 in units of
the critical density.
fgas should be the same as
baryon /
m. As an
upper limit for
baryon
can be determined
from primordial nucleosynthesis to be about 0.06 (for
H0 = 50 km/s/Mpc) one finds
m
0.3 - 0.4 in units of
the critical density.