


The ISOPHOT imaging studies have directly demonstrated that spiral galaxies are inhomogeneous. Variations in FIR colours between the observed structures indicate ISRFs which vary by orders of magnitude in intensity. In general, this can be attributed to an inhomogeneous distribution of both emitters and absorbers. Large variations in the colour of the ambient UV-optical radiation field are also expected, especially if structures are optically thick to all or part of the stellar light. Since the absorption probability of stellar photons by grains is a strong function of wavelength, this will also give rise to strong variations in the intensity and colour of the FIR emission. A quantitative interpretation of the FIR emission therefore requires realistic models for the propagation of stellar photons in galaxian disks, to calculate both the colour and intensity of radiation fields illuminating grains.
George Helou described the semi-empirical model of Dale & Helou (2002), which assumes a power law distribution of dust masses over UV-optical radiation energy densities (all of a common intrinsic colour). This model can reproduce observed trends in the MIR-FIR-submm colours of statistical samples, and has also been used to extract bolometric IR emission and dust masses from the ISO data. However, a quantitative interpretation of dust emission in terms of star formation rates and star formation histories requires a combined analysis of the UV-optical/FIR-submm SEDs, embracing a self-consistent model for the propagation of the photons.
There are several such models in use which incorporate various geometries for the stellar populations and dust. We will concentrate here on the model of Popescu et al. (2000a), since this is the only model where the geometry of the dust and stellar populations is directly constrained by the optical images. It is furthermore the only model which has been used to make direct predictions for the spatial distribution of the FIR emission for comparison with the ISO images. Full details of the model are given by Popescu et al. (2000a), Misiriotis et al. (2001) and Popescu & Tuffs (2002a). In brief, the model includes solving the radiative-transfer problem for a realistic distribution of absorbers and emitters, considering realistic models for dust, taking into account the grain-size distribution and stochastic heating of small grains and the contribution of HII regions. The FIR-submm SED is fully determined by just three parameters: the star-formation rate SFR, the dust mass Mdust associated with the young stellar population, and a factor F, defined as the fraction of non-ionising UV photons which are locally absorbed in HII regions around the massive stars.
Here we illustrate this model with the example of the edge-on galaxy NGC 891. The model can however be applied to galaxies of any inclination. The best fit obtained for the FIR-submm SED of NGC 891 is shown in the right hand panel of Fig. 3a.
 |
 |
Figure 3. a) The predicted SED of NGC 891 from
Popescu & Tuffs
(2002a),
for a model with SFR = 3.8
M |
|
If L0 is the intrinsic UV luminosity corresponding to unity SFR, the relation between the FIR luminosity LFIRtot and SFR can be described by:
| LFIRtot = LFIRHII + LFIRUV + LFIRopt |
| LFIRtot = SFR × L0 × F + SFR × L0 × (1 - F) × Guv + LFIRopt |
where Guv, which also depends on Mdust, is the probability that a non-ionising UV photon released into the diffuse dust will be absorbed there.
It can be seen that a natural outcome of this modelling technique is the prediction of a diffuse cold component of dust emission powered by a combination of non-ionising UV and optical-NIR photons, and a warm component of dust emission corresponding to the ensemble of discrete HII regions. This corresponds to what we have seen in the ISOPHOT maps of nearby galaxies.
The model also predicts the relative contributions of the young and old stellar populations to the dust emission as a function of FIR wavelength (Fig. 3b). An increase in the relative importance of UV heating in the diffuse dust emission component towards longer wavelengths is apparent. This arises because the coldest grains are those which are in weaker radiation fields, either in the outer optically thin regions of the disk or because they are shielded from radiation by optical depth effects. In the first situation the absorption probabilities of photons are controlled by the optical properties of the grains, so the UV photons will dominate the heating. The second situation arises for dust associated with the young stellar population, where the UV emissivity far exceeds the optical emissivity.
This analysis, together with the observational evidence from the maps produced by ISOPHOT, throws new light on the physical interpretation of the 60:100 µm ratio, which is commonly used as a gauge of star formation activity (Helou & Lonsdale 1987). This ratio has to be understood in terms of the inhomogeneous nature of disks in the FIR. Thus, the emission at 60 µm mainly traces locally heated warm grains in and around HII regions, whereas the emission at 100 µm mainly traces the emission from the diffuse dust, powered by optical photons as well as by (non-ionising) UV photons.
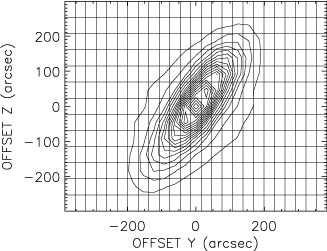
A particularly stringent test of the model is to compare its predictions for the morphology of the diffuse dust emission component near the peak in the FIR SED with spatially resolved maps. This comparison is shown in Fig. 4a,b, again for the case of NGC 891. A remarkable agreement between the maps is apparent. The residual map between the observed and the simulated maps of the diffuse component (Fig. 4c) reveals a compact source on the Northern side of the galaxy (and a faint extended source seen in the Southern side), with integrated fluxes in agreement with the model predictions for localised sources. The excess emission in the northern side may be a giant molecular cloud complex associated with one of the spiral arms. The remaining diffuse emission is at a level of 1% of the peak brightness and is probably attributable to residual detector artifacts.
 |
 |
 |
Figure 4. a) Contour plot of the observed brightness distribution of NGC 891 at 170µm (Popescu & Tuffs 2002a). The contours are plotted from 10.7 to 230.0MJy/sr in steps of 12.2MJy/sr. The grid indicates the actual measured sky positions sampled at 31 × 46" in the spacecraft coordinates Y and Z. b) Contour plot of the simulated diffuse brightness distribution of NGC 891 at 170µm. The contours are plotted from 10.4 to 239.7MJy/sr in steps of 10.4MJy/sr. c) Contour plot of the observed minus simulated diffuse brightness distribution of NGC 891 at 170µm. The contours are plotted from 2.2 to 46.1MJy/sr in steps of 3.1MJy/sr. The unresolved source from the Northern side of the galaxy and the faint extended source from the Southern side account for 8% of the integrated flux density, in agreement with the model prediction for FIR localised sources at this wavelength. |
||
 /yr,
F = 0.22 and Mdust = 7 × 10⁷
M
/yr,
F = 0.22 and Mdust = 7 × 10⁷
M