


In Athanassoula (2002; A02)
and A03 I tested the above analytical results
with the help of N-body simulations and I will follow the same path
here. The first point to test is that there are indeed stars at
(near-) resonance in the halo and that they absorb angular momentum, as
predicted by the analytical results. This is shown in
Fig. 1, which has been obtained as described
in A02 and A03. The upper panels plot the mass per unit
frequency ratio, MR, as a function of that frequency
ratio, namely ( -
p) /
-
p) /
 . Here
is the angular
frequency, is the
epicyclic frequency and
p is the bar
pattern speed. These panels show that the distribution is not at all
uniform, but has strong peaks at the resonances. This is
true both for the disc, as expected, but also for the halo, as shown
initially in A02. The lower panels show the change of angular momentum
with time (A03),
again as a function of the frequency ratio. Note that the theoretical
predictions of LBK, as well as those of A03, are well confirmed by the
above results, since these show that a large fraction of both the disc
and the halo particles are at resonance, and that they emit/absorb
angular momentum, as predicted.
. Here
is the angular
frequency, is the
epicyclic frequency and
p is the bar
pattern speed. These panels show that the distribution is not at all
uniform, but has strong peaks at the resonances. This is
true both for the disc, as expected, but also for the halo, as shown
initially in A02. The lower panels show the change of angular momentum
with time (A03),
again as a function of the frequency ratio. Note that the theoretical
predictions of LBK, as well as those of A03, are well confirmed by the
above results, since these show that a large fraction of both the disc
and the halo particles are at resonance, and that they emit/absorb
angular momentum, as predicted.
 |
Figure 1. Resonances and angular momentum
exchange. The upper panels give the mass per unit frequency ratio as
a function of that ratio at a time towards the end of the
simulation. The lower panels give
|
I next check how important the effect of the resonances is. This can be seen in Fig. 2, where I compare the face-on view of the results of three simulations. Initially, the leftmost is disc dominated in the inner parts, or, in the notation of AM02 and A03, it is of MD-type. On the contrary, the simulation shown in the middle panel has initially a large relative halo mass in the inner parts, i.e. it is of MH-type. Finally, the simulation at the right is initially exactly the same as the previous one, except that the halo is rigid (RH). In this case, the halo is only present as a rigid potential, so it can not participate in the angular momentum exchange. The difference between the middle and right panels is indeed stunning! Instead of the strong bar of the MH case, the RH case displays a short oval, confined to the inner parts. Furthermore, comparing the left and middle panels one can clearly see that the strongest bar has grown in the most halo dominated environment. These comparisons, and many others in AM02, A02 and A03, argue strongly for the role of resonances in bar evolution.
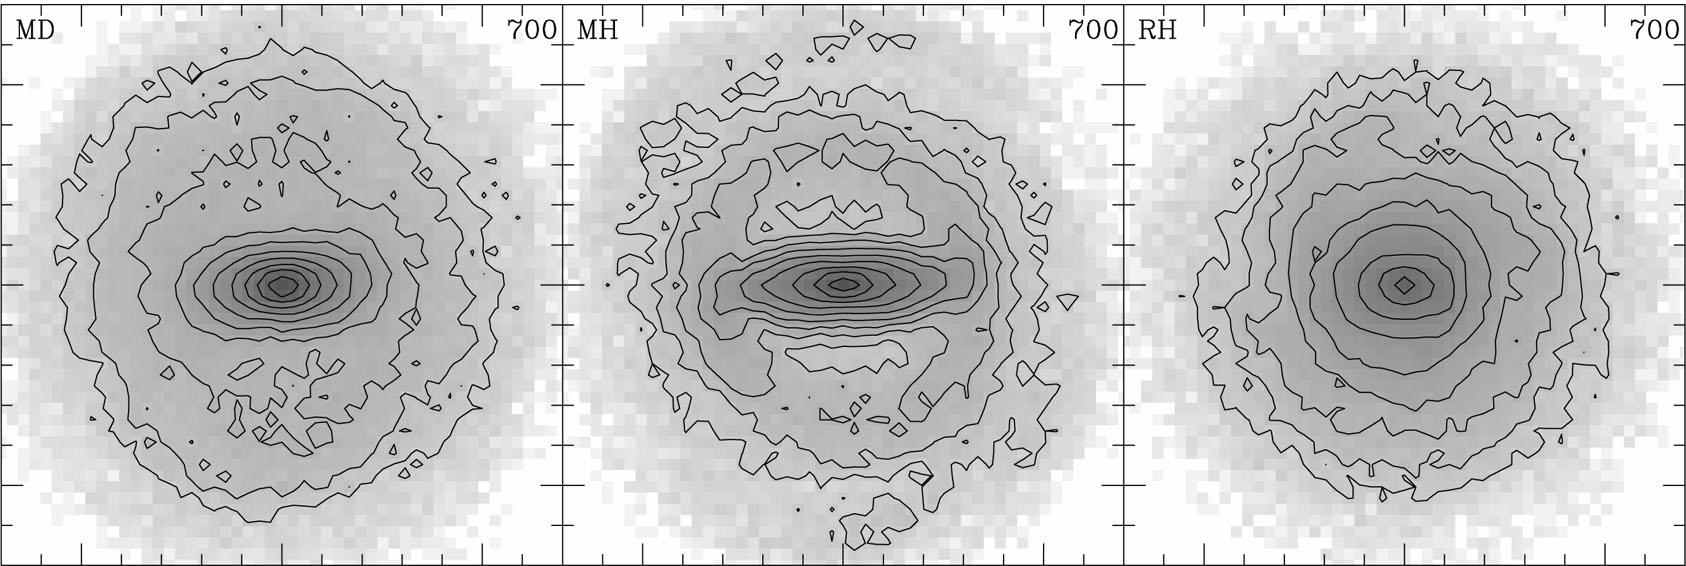 |
Figure 2. Effect of the halo on bar evolution : Face-on views of the results of three simulations with different halo components. |
Theory predicts that both the amount of mass at resonance and its velocity dispersion should influence the amount of angular momentum exchanged, and therefore the bar strength and the pattern speed decrease. A03, with the help of appropriate sequences of simulations, showed this to be indeed true in the case of N-body simulations. Thus, the increase of the bar strength and the decrease of its pattern speed are jointly set by three factors : the relative amount of halo mass at (near-) resonance, how hot the disc is at the resonances, and how hot the halo is at the resonances. Any one on its own is not sufficient to determine the outcome, since all three can limit the amount of angular momentum exchanged.
Since the amount of angular momentum exchanged is a determining factor, one expects to find correlations between this quantity and the bar evolution. Unfortunately, the angular momentum exchanged is a difficult quantity to measure, so in Fig. 3, as in A03, I use instead the total angular momentum gained by the halo, relative to the total angular momentum initially in the system. This, however, is a good approximation of the total angular momentum exchanged only in cases when the outer disc absorbs only little angular momentum. Even so, Fig. 3 shows, for a very large number of simulations, a clear correlation between the relative amount of angular momentum absorbed by the halo and the bar strength, as well as a trend between it and the bar pattern speed. Furthermore, if I limit myself to simulations where the halo is the main absorber (lower panels), then the latter trend becomes a very strong correlation (middle lower panel). These results are basically the same as those shown in A03, except that I have added here a few more simulations, which have been run since that paper was written.
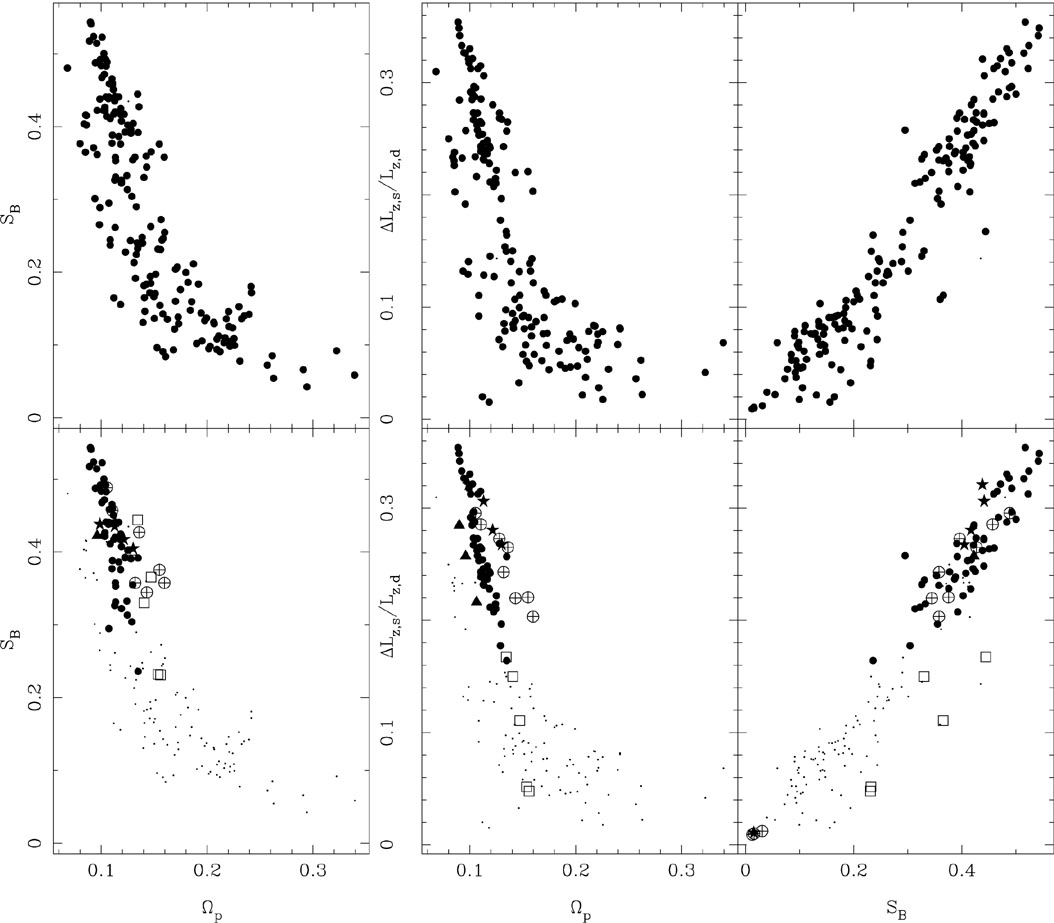 |
Figure 3. Relations between the strength
and the pattern speed of the bar (left panels), between the fraction of
the total angular momentum in the spheroid and the bar pattern speed
(middle panels) and between the same quantity and the bar strength (right
panels). Each symbol represents the result of one simulation (A03). In the
lower panels, results of simulations with a small initial
halo core radius are given with a large symbol, while those with a
large core radius with a dot. In particular, simulations with bulges are
marked with a |
How much are the above correlations dependent on the particular type of initial conditions used? It is reasonable to assume that initial conditions having different density and velocity profiles for the disc, bulge and halo component will also give such correlations, since these correlations are the reflection of the physics underlying bar evolution. However, it could well be that the regression lines (or loci defined by the trend) are somewhat differently located (shifted) on the corresponding planes. That can be properly tested only by repeating this type of work with different initial models; a rather daunting task seen the very large number of simulations necessary. Yet a few clues exist already. For example, from the middle lower panel one can see that the regression line is somewhat shifted to the right for simulations with a more concentrated spheroidal. Similarly, the right bottom panel shows that the regression line is somewhat lowered for simulations with initially hotter discs. The differences, however, are rather small, and one can conclude that more angular momentum exchange will lead to stronger bars that rotate slower.
Berentzen et al. (2003)
present a study where the
bar is driven by a companion in a disc in which a previous bar had
been destroyed by gas inflow. They find good
agreement of the results of their simulations with those presented
here on the (SB,
p) plane,
even though the initial
models and particularly the problem at hand are very different.
How does the amount of angular momentum exchanged influence the morphology of the bar? Fig. 4 shows the results of three simulations. In the one shown in the left panel a large amount of angular momentum was exchanged during the evolution. It has a strong bar, as is the case for all such simulations. The middle and right panels show examples from simulations where little angular momentum has been exchanged. In the middle one, the disc is initially hot and the halo is relatively cool and concentrated. Thus the outer disc can not contribute much to the angular momentum exchange and it is the halo that absorbs most of the angular momentum. The result is an oval, which extends to large radii, in order to maximize the emitting region. In the last example (right panel) the halo is very hot, so it can not absorb much angular momentum, while the disc is initially relatively cool. Thus the bar has to stay short, in order for its CR and OLR to be in regions of relatively high density, so as to contribute an efficient angular momentum sink. To summarize, one can say that cases where a lot of angular momentum has been exchanged always display strong bars. On the other hand, in cases where only little angular momentum has been exchanged, the bar can either be short, or longer but more like an oval, depending on whether it is the disc or the halo that is the main absorber.
 |
Figure 4. Effect of the amount of angular momentum exchanged on the morphology of the galaxy : Face-on view of the results of three simulations in which different amounts of angular momentum have been exchanged between different parts of the galaxy. |
 J, the angular
momentum gained, or lost, by the particles between two times, both
taken after the bar has formed,
again as a function of the frequency ratio. The left
panels correspond to the disc and the right ones to the spheroid.
The vertical dash-dotted lines give the positions of the main
resonances.
J, the angular
momentum gained, or lost, by the particles between two times, both
taken after the bar has formed,
again as a function of the frequency ratio. The left
panels correspond to the disc and the right ones to the spheroid.
The vertical dash-dotted lines give the positions of the main
resonances. , while
filled triangles, filled circles and filled
stars denote simulations with different initial core radius, in order
of increasing
concentration (see A03). Finally, open squares are for simulations
similar to those denoted by filled
circles, but which have initially very hot discs.
, while
filled triangles, filled circles and filled
stars denote simulations with different initial core radius, in order
of increasing
concentration (see A03). Finally, open squares are for simulations
similar to those denoted by filled
circles, but which have initially very hot discs.