


3.1. Inner slope values : technical and selection issues
Most observers conclude that
 in LSB galaxies is closer to 0.0 than to -1.0, and almost all find
that the decomposition mass models work better if the dark halo
is modelled with a (pseudo-) isothermal sphere, or a Burkert profile,
rather than with the NFW profile. However, some authors maintain
that the problem of determining the inner slope is fraught with
systematic effects, which all magically contribute towards shallower
slopes. The issue debated is not only about the best value for the
inner slope, but also whether a slope of -1.0 can be
reasonably excluded, so as to force a modification of the
in LSB galaxies is closer to 0.0 than to -1.0, and almost all find
that the decomposition mass models work better if the dark halo
is modelled with a (pseudo-) isothermal sphere, or a Burkert profile,
rather than with the NFW profile. However, some authors maintain
that the problem of determining the inner slope is fraught with
systematic effects, which all magically contribute towards shallower
slopes. The issue debated is not only about the best value for the
inner slope, but also whether a slope of -1.0 can be
reasonably excluded, so as to force a modification of the
 CDM picture at
galaxy scales.
See also the contributions by De Blok and by Swaters (this volume).
CDM picture at
galaxy scales.
See also the contributions by De Blok and by Swaters (this volume).
On the selection side, the debate is about the quality and
relevance of the data. As
more galaxies are observed, stricter selection criteria
can be used to retain only galaxies with sufficiently "good" data.
Thus one excludes 1) galaxies with poor angular resolution, thereby
requiring in most cases supplementary
H data in addition to a HI
rotation curve, so that the inner 1 kpc of a galaxy is well probed.
This excludes far away galaxies or galaxies for which there is only
low resolution HI data, and thus minimizes slit width effects;
2) edge-on galaxies, which are apparently too difficult to understand
for some workers in the field, despite demonstrations by
Bosma et al. (1992) and
Matthews & Wood (2001)
that small galaxies seen
edge-on are transparent and have rotation curves which are slowly
rising in the inner parts. The argument that somehow there is no
emission at the tangent point leads to very peculiar
H
distributions in more face-on galaxies which are yet to be seen;
3) galaxies with large asymmetries, faint emission, etc., which
have low quality rotation curves.
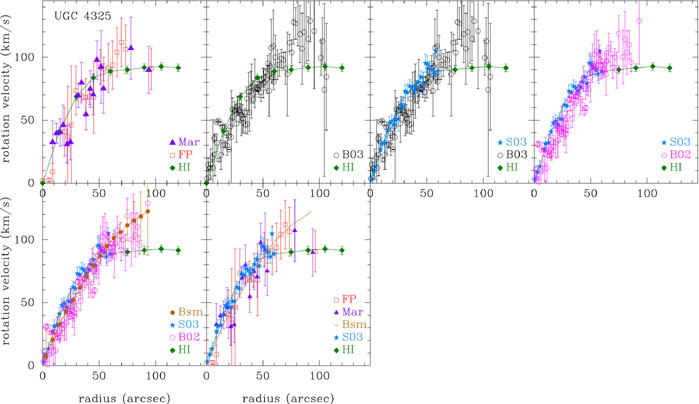
De Blok, Bosma & McGaugh (2003) applied these criteria to data of McGaugh et al. (2001) and De Blok & Bosma (2002), and find for a restricted sample that the values of the inner slope are between 0.2 and -1.0 (see De Blok, this volume). Swaters et al. (2003a), in a similar study, come to a similar conclusion. De Blok et al. (2003) also report about deliberate slit offsets and misalignments for one galaxy, UGC 4325, and conclude that these effects could not magically bring the slope from about -0.2 to -1.0, although of course scatter is introduced if the major axis is not observed correctly.
Finally, for several galaxies there are more than one observation, done with different telescopes, and by different observers. Even though the error bars are sometimes unsatisfactory large, there is good agreement in general. The situation for UGC 4325, debated at the meeting, is shown in Figure 3. The HI position-velocity diagram prompts me to think that the peak velocity is indeed around ~ 110 km/s as it is in the optical, after which the rotation curve declines.
 |
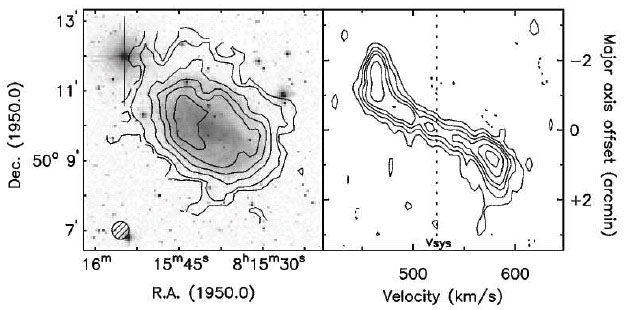 |
Figure 3. Comparison of data for UGC 4325. HI data from Swaters 1999 (HI), Fabry-Pérot data from Garrido et al. 2002 (FP), long slit data from Marchesini et al. 2002 (Mar), De Blok & Bosma 2002 (B02), De Blok et al. 2003 (B03), and Swaters et al. 2003a (S03). Bsm represents smoothed long slit data as described in B02. At bottom the HI distribution and position-velocity diagram from Swaters 1999. |