


The full LWS spectrum of the second brightest ultraluminous galaxy Mkn 231 (Harvey et al. 1999) is similar to that of Arp 220 (to within the achieved signal-to-noise ratio). It is dominated by OH absorption, with similar OH absorption line ratios, and only faint [CII]158µm line emission is present. Based on the mid-infrared spectra of a sample of nearby ULIGs, Genzel et al. (1998) infer that Mkn 231 has a strong AGN component while the far-infrared luminosity of Arp 220 is powered by a starburst. Thus the similarity of the far-infrared spectra of these two ultraluminous galaxies is surprising. Indeed, Luhman et al. (1998; 2000) find that the [CII]158 / FIR ratio in ULIGs is typically an order of magnitude fainter than in lower luminosity starburst and normal galaxies (Figure 7).
 |
Figure 7. The [C II] 158µm line flux versus FIR flux for 12 ULIGs observed with the LWS (Luhman et al. 1998; 2000) compared with a sample of normal and starburst galaxies (Luhman et al. 1998; Lord et al. 1996; Colbert et al. 1999; Stacey et al. 1999; Bradford et al. 1999). In the symbol key, the galaxies are listed in order of luminosity from top to bottom and the ULIG symbols are black filled, while the lower luminosity galaxies are unfilled. ULIGs are defined as in Sanders & Mirabel (1996). The dashed lines mark the regime typical of normal and starburst galaxies. From Luhman et al. (2000). |
Based on single dust temperature fits and measured millimeter size
constraints the far-infrared dust emission of the nearest ULIG, Arp 220,
is thought to be optically thick
(Scoville et
al. 1991;
Fischer et
al. 1997)
throughout most of the LWS
range. Single dust temperature models that fit our LWS spectrum with
optical depth
 (100µm)
 1, would imply dust
emission regions 3-4 times
larger in angular area than what is measured at 1.3-mm by
Sanders and
Mirabel (1996),
and more detailed radiative transfer models assuming central, spherical
geometry,
Draine and Lee
(1984)
dust, and power law density point toward high optical depth even in the
far infrared
(Fischer et
al. 1997;
2000).
Indeed, non-local radiative transfer models of Eduardo Gonzalez-Alphonso
and Pepe Cernicharo using
identical ensembles of clouds with radii of 1018 - 2 ×
1019 cm and densities of 105 - 107
cm-3 can best explain the H2O absorption lines in
Arp 220 for
FIR
1, would imply dust
emission regions 3-4 times
larger in angular area than what is measured at 1.3-mm by
Sanders and
Mirabel (1996),
and more detailed radiative transfer models assuming central, spherical
geometry,
Draine and Lee
(1984)
dust, and power law density point toward high optical depth even in the
far infrared
(Fischer et
al. 1997;
2000).
Indeed, non-local radiative transfer models of Eduardo Gonzalez-Alphonso
and Pepe Cernicharo using
identical ensembles of clouds with radii of 1018 - 2 ×
1019 cm and densities of 105 - 107
cm-3 can best explain the H2O absorption lines in
Arp 220 for
FIR
 1
(Fischer et
al. 2000).
These model fits indicate that the levels are populated by absorption of
photons emitted by warm dust. This suggests that the excited molecules
may be located in PDRs associated with H II regions or an AGN,
where the infrared radiation field would be particularly intense.
1
(Fischer et
al. 2000).
These model fits indicate that the levels are populated by absorption of
photons emitted by warm dust. This suggests that the excited molecules
may be located in PDRs associated with H II regions or an AGN,
where the infrared radiation field would be particularly intense.
Genzel et
al. (1998)
find that for Arp 220 a screen model with Av =
45 best
fits the SWS mid-infrared recombination line fluxes, but point out that
a mixed gas and dust model with Av = 1000 would
provide moderate agreement in the near- and mid-IR. If indeed
(150µm) = 1 and
Av ~ 1000 for Draine & Lee dust
(Fischer et
al. 1997),
a purely mixed extinction model predicts an extinction correction of (1 -
e-) /
= 0.33 for the
[OIII]88 µm line. Even with
(150µm) = 10,
the 88 µm line should have been detected at the
3 level for the pure
mixed case. While in the galaxies
M 82 and Arp 299 the [OIII] 88µm line is about 1%
of the LWS far-infrared luminosity, it is < 0.1%
(3) in Arp 220. Thus,
the extinction estimated from the mid-infrared lines is not enough to
explain the lack of [OIII] 88µm line emission in Arp 220 if
its intrinsic spectrum looks like that of M 82.
level for the pure
mixed case. While in the galaxies
M 82 and Arp 299 the [OIII] 88µm line is about 1%
of the LWS far-infrared luminosity, it is < 0.1%
(3) in Arp 220. Thus,
the extinction estimated from the mid-infrared lines is not enough to
explain the lack of [OIII] 88µm line emission in Arp 220 if
its intrinsic spectrum looks like that of M 82.
Can low photoelectric heating efficiency in high <Go> / n PDRs, as proposed by Malhotra et al. (1997; 2000), explain the low [CII] emission in ULIGs and other [CII] deficient galaxies? The [OI] 63µm / [CII] 158µm line ratio found in the two ULIGs where [OI] 63µm is detected is consistent with higher <Go> / n (Luhman et al. 2000). On the other hand, the upper limit on the [OI] 145µm/[CII] 158µm line ratio found in Arp 220 (Fischer et al. 1997) is inconsistent with high <Go> / n, unless there is foreground absorption the [OI]145 µm line, or if almost all of the [CII] line emission in Arp 220 originates in the diffuse ionized medium, as suggested may be the case for many galaxies by Malhotra et al (2000b). Comparing their observations of the ground state fine-structure line of atomic carbon to the [CII] 158µm line, CO rotational lines, and the FIR flux, Gerin & Phillips (1998; 2000) find evidence for high <Go> and high n in the ULIGs Arp 220 and Mkn 231, but suggest that dust absorption and/or [CII] line opacity must also play a role.
Luhmann et al. (2000) have found that the average value and spread of the [CII] 158µm line intensity to 6.2 µm PAH feature intensity ratio is similar in ULIGs and other IR-bright galaxies (Figure 8). The 6.2 µm feature was chosen because it is an isolated feature, well separated from other narrow PAH features and the 9.8 µm silicate absorption feature. The 6.2µm PAH feature flux was measured from CAM CVF spectra, integrated over the full LWS beam for galaxies with extended emission, and from PHOT-S spectra for compact galaxies. High <Go> / n conditions causing low values of the [CII]/FIR ratio, would not produce correspondingly low 6.2 µm feature flux, unless a significant fraction of the grains responsible for the 6.2 µm feature are destroyed by these conditions. However, laboratory studies indicate that PAH sizes greater than 50 C-atoms probably dominate the emission in this band (Hudgins & Allamandola 1999) while theoretical studies indicate that it is difficult to destroy PAHs with greater than 50 C-atoms in the regimes of <Go> / n thought to exist in these galaxies (Allain et al. 1996). The fact that similar flux ratios are found in both IR-bright galaxies and ULIGs therefore suggests that properties such as the average differential extinction and the average photoelectric heating efficiency are similar in these galaxies. Alternatively, effects such as higher average differential extinction and lower photoelectric heating in ULIGs relative to other IR-bright galaxies may cancel each other to produce the observed linear correlation.
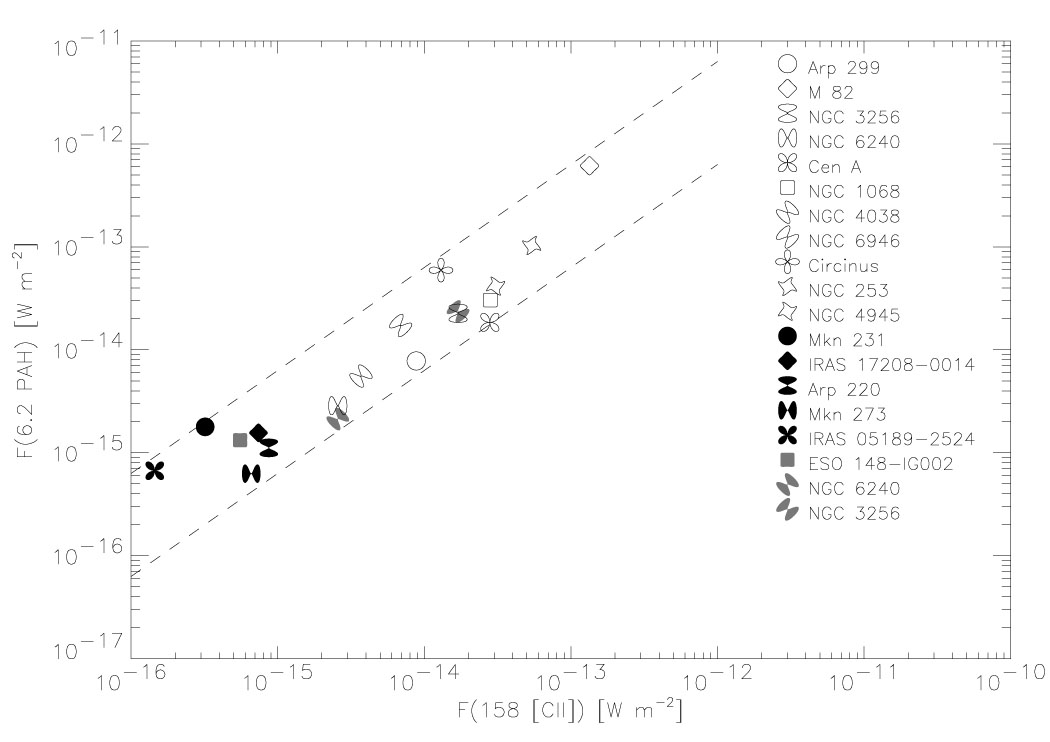 |
Figure 8. The 6.2 µm PAH feature versus versus [C II] 158µm line flux for ULIGs and other IR-bright galaxies. The 6.2µm PAH emission was measured from CAM CVF spectra (open symbols), integrated over the full LWS beam for galaxies with extended emission, and from PHOT-S spectra (filled symbols) for compact galaxies (Dudley et al. 2000). Black, filled symbols are ULIGs, while unfilled or grey filled symbols are lower luminosity galaxies. Dashed lines show a range of a factor of 10 in the flux ratio. From Luhman et al. (2000). |
Scoville et al. (1991) noted the low ratio of the infrared luminosity LFIR to the Lyman continuum photon rate Q derived for Arp 220 from 2.7 mm observations. In fact, based on the Lyman continuum rate measured at 3.3 mm for M 82 (Carlstrom & Kronberg 1991), and assuming Te = 10,000 K for both galaxies, L / Q is a factor of 3.6 times higher in M 82. Sanders and Mirabel (1996) suggest that this is due to increased dust absorption of Lyman continuum photons. Comparison with CLOUDY (Ferland 1993) models indicates that this can explain the low intensity of the FIR fine-structure lines, but would not produce lower excitation if Draine and Lee (1984) dust is used. Further modeling is needed to determine whether increased dust opacity within ionized regions, due perhaps to increased metallicity or evolutionary effects, can quantitatively explain the low [CII] / FIR ratios, warmer dust temperatures, and OH and H2O far-infrared absorption from excited levels.