


In a previous paper (Holmberg 1940) the writer has used a special procedure, somewhat different from the method to be applied in this investigation, to study the grouping tendencies among galaxies. The analysis led to a statistical separation of physical and optical companions; the groups were revealed as they actually exist in space. In circular areas around presumptive central galaxies from the Shapley-Ames catalogue (1932) physical and optical companions were picked up, the material being supplied by the General Catalogue, as revised by Reinmuth (1926). If the radius of the survey areas is large enough, the statistical distribution of the observed separations can be dissected into two parts: one distribution corresponding to the background foreground field and another referring to physical companions.
For Sh-A galaxies with m = 12.1 - 13.0 it was found that the mean separation of the latter companions amounts to 15' and the maximum separation to about 50'.
By means of the redshifts available it is now possible to calibrate these results. The Reference Catalogue by de Vaucouleurs et al. (1964) and a subsequent list by the same authors (1967) give redshifts for 290 Sh-A galaxies with m = 12.1 - 13.0 (Virgo cluster area omitted); the mean redshift as reduced to the galactic center is 2150 km/sec. With a Hubble parameter H = 80 km/sec. per Mpc, the above mean separation corresponds to 118 kpc, and the maximum separation to about 400 kpc. Furthermore, 28% of the physical companions have separations from the central galaxy of less than 50 kpc.
For the sake of completeness, the analysis will be repeated by using
individual distances to the central galaxies, as derived from the
redshifts. In the case of Sh-A galaxies with
m  13.0,
gal. lat. > +30°, and
13.0,
gal. lat. > +30°, and
 > -20°
(the limits of the previous material) redshifts above 1490 km/sec are
available from the above sources for 111 objects outside the
Virgo cluster area. In order to get a radius of the
survey areas of at least
650 kpc, corresponding to the radius of 2° used in the previous
analysis, it has been necessary to adopt this rather high redshift
limit; the value of the redshift as a distance
indicator is however improved. The resulting distributions of the
separations of physical and optical companions in the 111 survey areas
are shown in Fig. 1. The latter
distribution is represented by a straight line, the inclination of which
is based on the frequencies in the outer parts of the survey areas. The
histogram refers to the physical
companions, their total number amounting to 83. We find a mean
separation for the latter of 110 kpc and a maximum separation of about
300 kpc; the relative number
of physical companions with separations of less than 50 kpc is 30%.
> -20°
(the limits of the previous material) redshifts above 1490 km/sec are
available from the above sources for 111 objects outside the
Virgo cluster area. In order to get a radius of the
survey areas of at least
650 kpc, corresponding to the radius of 2° used in the previous
analysis, it has been necessary to adopt this rather high redshift
limit; the value of the redshift as a distance
indicator is however improved. The resulting distributions of the
separations of physical and optical companions in the 111 survey areas
are shown in Fig. 1. The latter
distribution is represented by a straight line, the inclination of which
is based on the frequencies in the outer parts of the survey areas. The
histogram refers to the physical
companions, their total number amounting to 83. We find a mean
separation for the latter of 110 kpc and a maximum separation of about
300 kpc; the relative number
of physical companions with separations of less than 50 kpc is 30%.
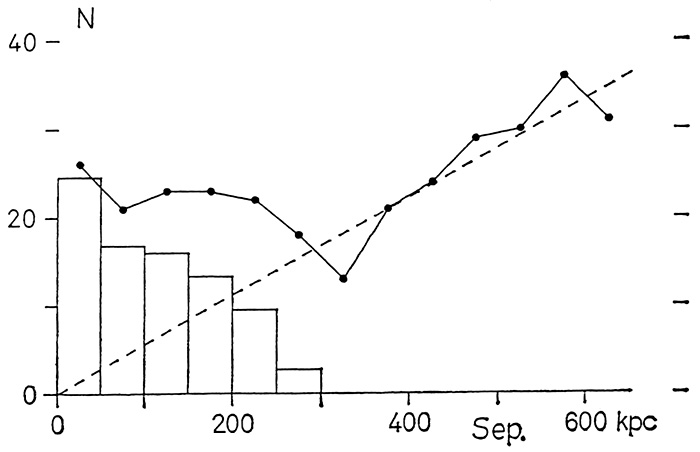 |
Figure 1. Statistical distributions of separations, based on redshift distances, of physical and optical companions to 111 Shapley-Amen galaxies. |
The above results have been given in some detail on account of their importance as a background to the subsequent analysis. To summarize, we have found mean separations of physical companions from the central galaxy of 111, 118, and 110 kpc, respectively, and maximum separations of 300-400 kpc; the relative frequency of companions with separations of less than 50 kpc amounts, on an average, to 30%. It should be kept in mind that these results are of an empirical nature; the only assumption involved refers to the value adopted for the Hubble parameter.
The results found here, as well as the results of the following sections, are in disagreement with those derived by Zonn (1968) from a study of double galaxies on the Palomar Sky Atlas. The reason may be the rather complicated procedure used by Zonn and its dependence on a number of assumptions. On the other hand, the results agree with the conclusions by Swjagina (1966), also based on the Sky Atlas, that dwarf satellites accompany over 50% of all galaxies.