


7.4. Evolution of CMB data
The pace of progress in CMB experiments has maintained an
astonishing rate for a decade. Following the 1992 COBE
detection of fluctuations, 5 years of effort yielded the
unclear picture of the first panel in figure 18,
in which of order 10 experiments gave only vague evidence for a peak in
 2
C. By the
year 2000, this had been transformed to a clear picture of a peak
at
2
C. By the
year 2000, this had been transformed to a clear picture of a peak
at
 200, although there was
no model-independent evidence for higher harmonics.
The present situation is much more satisfactory,
with 3 peaks established in a way that does not require
any knowledge of the CDM model.
200, although there was
no model-independent evidence for higher harmonics.
The present situation is much more satisfactory,
with 3 peaks established in a way that does not require
any knowledge of the CDM model.
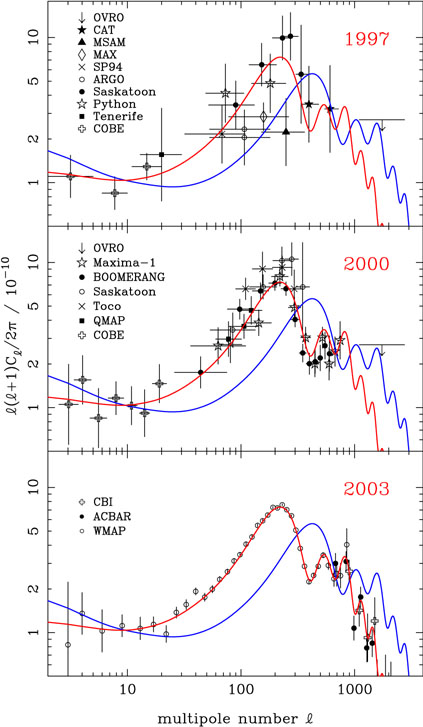 |
Figure 18. Dramatic change took place in CMB
power spectrum measurements around the turn of the 21st century.
Although some rise from the COBE level was arguably known even by 1997,
a clear peak around |
The WMAP results (Spergel et al. 2003) measure the power spectrum about as well as possible (i.e. hitting the limit of cosmic variance from a finite sky) up to the second peak. At smaller scales, however, there is still much scope for improvement, and the rate of advance is unlikely to drop in the future. The useful web page http://background.uchicago.edu/~whu/cmbex.html lists 14 ongoing experiments, as well as 19 completed ones.
 800,
limited mainly by cosmic variance, had been made by the WMAP
satellite.
800,
limited mainly by cosmic variance, had been made by the WMAP
satellite.