


From the earliest radio observations of pulsar periods, and of the rates at which the periods were increasing, it was found that from 1035 to 1039 erg s-1 of rotational energy was being lost. The radio luminosities were typically orders of magnitude smaller, and even in those cases with X-ray emission, such as the Crab Nebula and Vela Pulsar (Fig. 2), the total radiated luminosity was a very small fraction of the energy loss. It was presumed that the balance went into relativistic particles (Michel (1969a)) and driving a wind (Michel (1969b)). In some cases, a plerion, or pulsar wind nebula, was present, and interpreted as the manifestation of the outflow. The picture was that a cold, relativistic gas was driven away from the speed of light cylinder. This gas would not be directly detectable, until it formed a shock where it encountered the nebular gas. Gaensler (2003) gives an excellent review of all these issues.
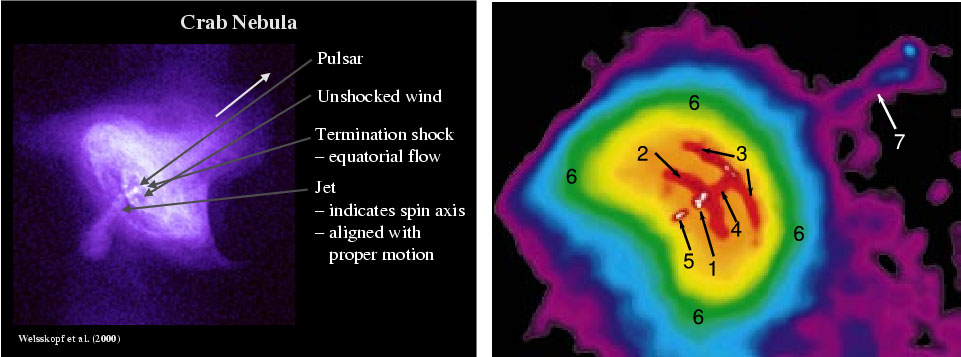 |
Figure 2. Chandra images of the Crab Nebula (left, NASA/CXC, from Weisskopf 2000) and the Vela Pulsar Nebula (right, from Pavlov 2003). The large arrow on the left shows the direction of the spin axis and the proper motion, for both pulsars. Numbered regions in Vela indicate 1. pulsar; 2. termination shock; 4. and 5. the inner jet and counterjet, respectively; 7. the outer jet. |
We now see this termination shock in the Crab and Vela as indicated in Figure 2. The figure shows rings indicating equatorial flow, and jets. The jets must be along the rotational axis, and not the magnetic pole, since the latter must sweep a wide cone on the sky, giving pulses when it intersects our line of sight. These pulsars give us a clear case of a jet which is associated with rotation.
Figure 3 (from Pavlov 2003), shows a sequence of X-ray images of the outer jet in the Vela Pulsar Nebula, over an 8 month time interval. There are distinct morphological and brightness changes, e.g., in as few as 7 days from 4 to 11 December, 2001. These changes are attributed to magnetic instabilities in the jet, and/or its interaction with the interstellar medium.
 |
Figure 3. Time sequence of the outer Vela jet (Pavlov 2003), showing remarkable changes in morphology, and apparent relativistic motion of blobs. Image 10 is with the HRC, the others are with ACIS S3. |
Figure 3 (right column) plots the position vs. time for two of the knots, "A" and "B" relative to the narrow rectangle which is superposed in fixed celestial coordinates in the images. At the distance of the Vela pulsar, 300 pc, these motions respectively correspond to 0.35 and 0.51 times the velocity of light. The changing image may be due to moving material or to moving patterns in the jet.
Figure 4 (from Gaetz (2000), figs 5. and 6.) shows the supernova remnant 1E 0102.2-7219 in the Small Magellanic Cloud (SMC). It is a young, oxygen rich remnant, which has been observed repeatedly since orbital activation as a calibration target. Flanagan (2000), and Fredericks (2001) discuss HETG observations which show details of the X-ray line ionization structure and velocities. Gaetz (2000) discuss how the X-ray picture shows for the first time the sharp interaction of the the outgoing shock with the interstellar medium, delineated by the outer edge of the X-ray gray-scale image to the left. The most intense X-ray ring is the reverse shock, moving back into the expanding medium. The radio emission is brightest in the region between the two shocks, with the interpretation that the shocks are intensifying the magnetic fields, and accelerating the particles.
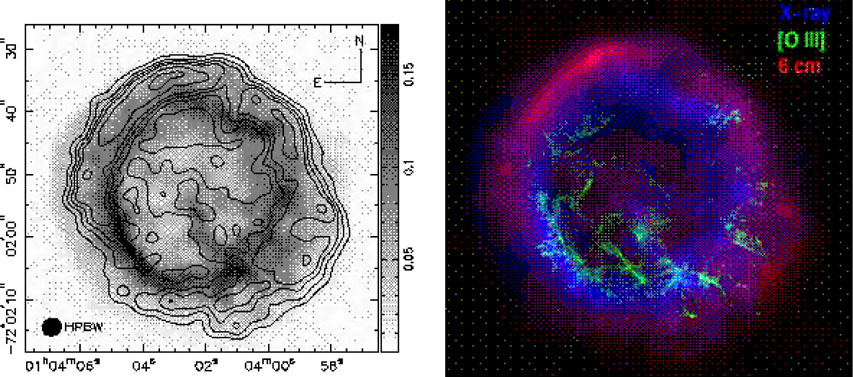 |
Figure 4. Left Panel (Figure 5 from Gaetz (2000)): X-ray (gray scale) and radio (contours) images of the supernova remnant E0102-72 in the SMC. Right Panel (Figure 6 from Gaetz (2000)): X-ray (blue), 6 cm (red) and optical [O III] emission (green). |
The composite supernova remnant Kes75 is discussed by Helfand (2003) (figure 5). The false-color X-ray image in the left panel shows the shell structure of the outer shock, the peak X-ray intensity consistent with a reverse shock, and the 20 cm VLA radio emission from the outer, shocked X-ray emitting regions, all as in E0102-72. There is also a radio and X-ray bright central nebula, for which their expanded image (top center) shows a synchrotron nebula, a pulsar, and hot spots to the NNE and SSW which might be from a jet. Helfand (2003) analyze the spectrum of the pulsar, and the nebula, separately, and show they are continuous, non-thermal emission, which they attribute to synchrotron radiation (figure 5, top right panel). Perhaps their most interesting discovery is in the X-ray spectrum of a broad region of the shell remnant, shown in the lower right. While lines of Mg, Si, and S are clearly present, and require a hot gas, no purely thermal emission model (indicated by the histogram) can provide both the line emission and all the continuum emission up to the 7 keV plotted in the figure. They model a combination of a thermal and a synchrotron spectrum, where the latter is due to a dust halo scattering the X-ray emission from the pulsar and its synchrotron nebula.
 |
Figure 5. The composite supernova remnant Kestevan 75 (adapted from Figures 1, 2, 3, and 7 of Helfand (2003)). Left panel: False color X-ray image with 20 cm radio contours. Top center: X-ray image of the pulsar and synchrotron nebula. Right panels: X-ray spectra of the pulsar, synchrotron nebula, and a region of the shell inside the shock. |