


15.4.5. Redshift and Luminosity Distributions of Strong Sources
Spectroscopic redshifts exist for nearly all 3CR sources stronger than
10 Jy at 178 MHz
(Laing et al. 1983,
Spinrad et al. 1985)
and for most of the stronger
flat-spectrum sources found in high-frequency radio surveys
(Kühr et al. 1981,
Véron-Cetty and
Véron 1983,
Wall and Peacock 1985).
Photometric redshifts of the
remaining strong sources identified with galaxies can be estimated from
Hubble relations such as
log(z)  (m
(m - 22.5) /
6 valid for first-ranked cluster galaxies and 3CR and 4C radio galaxies
(van der Laan and
Windhorst 1982,
Windhorst 1986);
empty-field sources can be treated as galaxies just fainter than the
plate limit. Redshift distributions of quasar candidates may be
approximated by the redshift
distributions of known quasars or by a broad Hubble relation
(Wall and Peacock 1985).
Let N(z | S,
) d[log(z)] be
the integral number of sources per steradian with redshifts
log(z) to
log(z) + d[log(z)] and stronger than S at
frequency . Such an
(unnormalized) redshift distribution of 202 extragalactic sources
stronger than S = 2 Jy at
= 1.4 GHz is shown in
Figure 15.9.
- 22.5) /
6 valid for first-ranked cluster galaxies and 3CR and 4C radio galaxies
(van der Laan and
Windhorst 1982,
Windhorst 1986);
empty-field sources can be treated as galaxies just fainter than the
plate limit. Redshift distributions of quasar candidates may be
approximated by the redshift
distributions of known quasars or by a broad Hubble relation
(Wall and Peacock 1985).
Let N(z | S,
) d[log(z)] be
the integral number of sources per steradian with redshifts
log(z) to
log(z) + d[log(z)] and stronger than S at
frequency . Such an
(unnormalized) redshift distribution of 202 extragalactic sources
stronger than S = 2 Jy at
= 1.4 GHz is shown in
Figure 15.9.
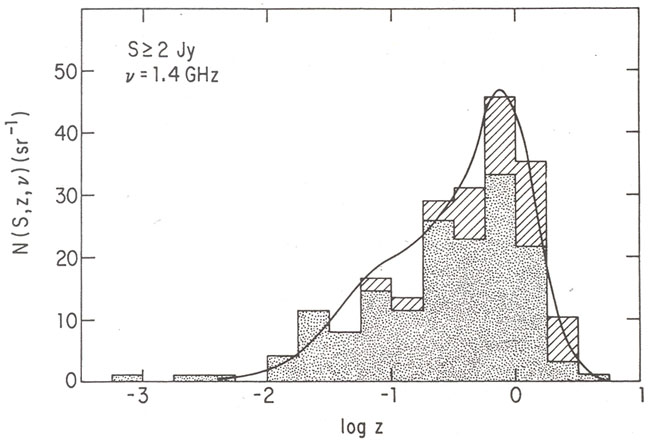 |
Figure 15.9. Redshift distribution of 202
sources stronger than S = 2 Jy at
|
Since most of the sources in a flux-limited sample are within a factor
of two of the flux-density limit, the integral luminosity distribution
N(L| S,
) d[log(L)], or
number of sources per steradian with luminosities log(L) to
log(L) + d[log(L)] that
are stronger than flux density S at frequency
, can be used
almost interchangeably with the integral redshift distribution. However,
both of these distributions bin the
(S, z)-data and hence do not make the most efficient
possible use of the strong-source data
(Peacock 1985).