


2.1. The luminosity-surface brightness plane
The luminosity-surface brightness plane (LSP) is of particular
interest because it enables one to compensate for both luminosity
(Malmquist bias) and surface brightness selection effects (aka
"Disney bias"). In
Driver et al. 2004
the LSP is derived for the MGC,
which provides the most robust current estimate. The MGC LSP analysis
used the joint luminosity-surface brightness Step-Wise Maximum
Likelihood method of
Sodré &
Lahav 1993
and incorporate into this tracking
of 5 selection boundaries relevant to each individual galaxy
(i.e., maximum & minimum observable size & flux and
minimum observable central surface brightness for detection, see
Driver 1999).
An additional feature is the derivation of
individual K-corrections using the combined MGC and SDSS-DR1 colours
(uBgriz). Fig. 2 shows the data as a
series of Gaussian
fits across the LSP at progressive intervals of absolute magnitude.
The thicker weighted lines shows the surface brightness distribution
for the most luminous galaxies and the fainter lines for the dwarf
regime. Two facts leap out. Firstly that the distributions are
bounded (the Gaussian fits have good
 2's) broadening
towards
lower luminosity. Secondly the peak of the distribution moves towards
lower surface brightness for lower luminosity systems. In other words
low luminosity systems apparently show greater surface brightness
diversity than giant systems. However this can also be interpreted in
terms of the Kormendy relation for spheriods
(Kormendy 1977) and
Freeman's Law for disks
(Freeman 1970).
These two classic studies
unveiled distinct relations for the structural properties of spheroid
and disk components. The Kormendy study found that the more luminous
the spheroid the lower its central surface brightness. Conversely
Freeman's study found that all disks, regardless of luminosity, have a
constant central surface brightness of
µoBMGC
= 21.65 ± 0.3 mag arcsec-2. The MGC result shown on
Fig. 2 are for the combined bulge+disk
systems. Around L*
the effective surface brightness for spheriods and disks is fairly
close - a long-time nagging coincidence. However moving towards
lower luminosity the trends for spheriods and disks diverge leading to
the broadening of the global surface brightness distribution. To
investigate further hence requires separating out these two structural
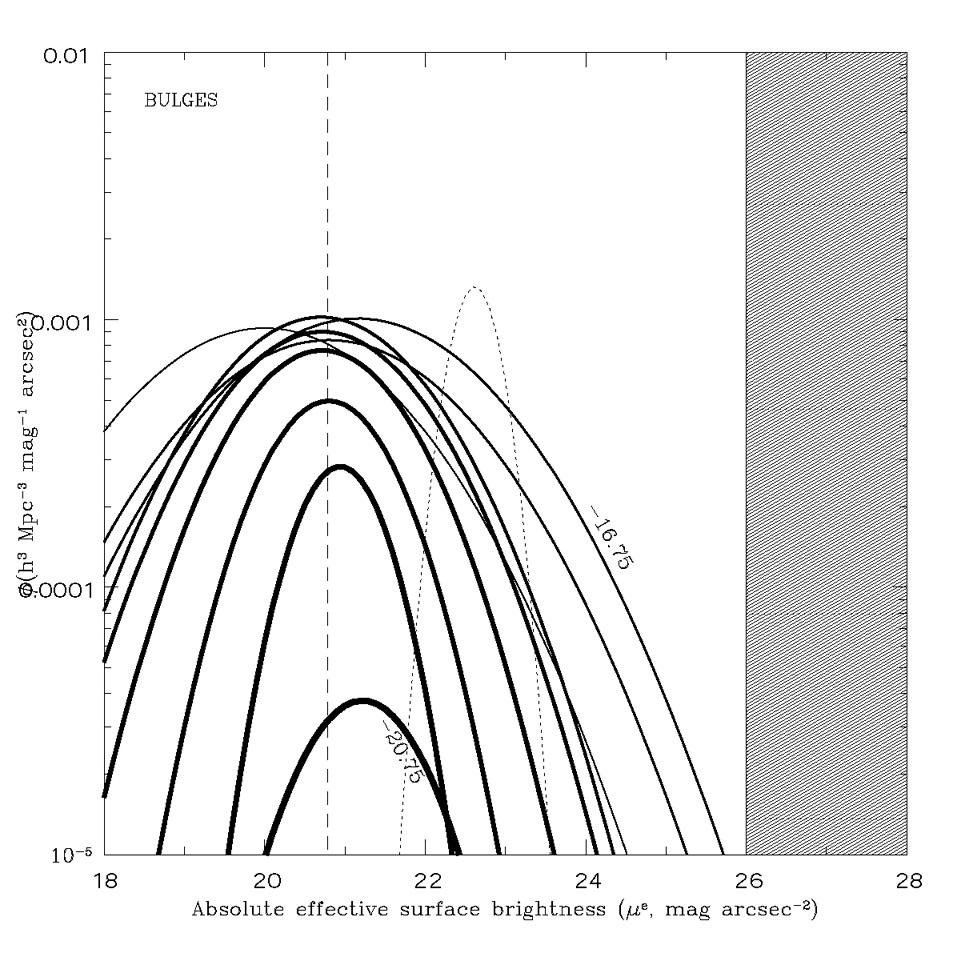
components via 2D bulge-disk decomposition. Here we use GIM2D
(Simard et al. 2002)
and Fig. 3 shows the data of
Fig. 2 subdivided by structural component.
The dotted line shows the original Freeman distribution which remains
relevant today, albeit with a far broader dispersion than originally
reported (see
Freeman 1970).
It would
seem that galaxies consist of two principle components (presumably
formed via two mechanisms: merging and accretion/collapse ?) and to
unravel these two phases in detail must require robust bulge-disk
decompositions of extensive samples over a variety of epochs.
2's) broadening
towards
lower luminosity. Secondly the peak of the distribution moves towards
lower surface brightness for lower luminosity systems. In other words
low luminosity systems apparently show greater surface brightness
diversity than giant systems. However this can also be interpreted in
terms of the Kormendy relation for spheriods
(Kormendy 1977) and
Freeman's Law for disks
(Freeman 1970).
These two classic studies
unveiled distinct relations for the structural properties of spheroid
and disk components. The Kormendy study found that the more luminous
the spheroid the lower its central surface brightness. Conversely
Freeman's study found that all disks, regardless of luminosity, have a
constant central surface brightness of
µoBMGC
= 21.65 ± 0.3 mag arcsec-2. The MGC result shown on
Fig. 2 are for the combined bulge+disk
systems. Around L*
the effective surface brightness for spheriods and disks is fairly
close - a long-time nagging coincidence. However moving towards
lower luminosity the trends for spheriods and disks diverge leading to
the broadening of the global surface brightness distribution. To
investigate further hence requires separating out these two structural
components via 2D bulge-disk decomposition. Here we use GIM2D
(Simard et al. 2002)
and Fig. 3 shows the data of
Fig. 2 subdivided by structural component.
The dotted line shows the original Freeman distribution which remains
relevant today, albeit with a far broader dispersion than originally
reported (see
Freeman 1970).
It would
seem that galaxies consist of two principle components (presumably
formed via two mechanisms: merging and accretion/collapse ?) and to
unravel these two phases in detail must require robust bulge-disk
decompositions of extensive samples over a variety of epochs.
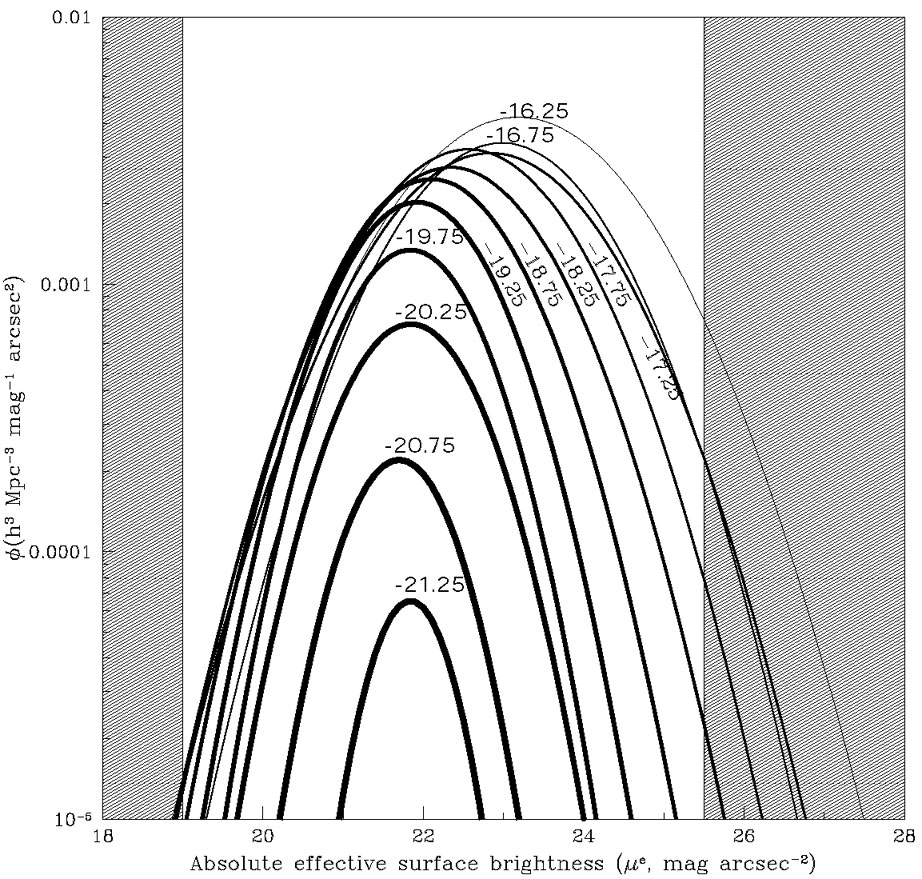 |
Figure 2. The surface brightness distribution of galaxies at various luminosity intervals (as indicated). The curves show the Gaussian fits to the recovered joint luminosity-surface brightness distribution of Driver et al. (2004). The shaded region denotes the limits at which strong selection effects are likely to impact upon the observed distributions. Generally the distribution is narrow and constant for the brightest galaxies (aka Freeman's Law) and then broadens towards lower surface brightness for lower luminosity systems. |
 |
 |
Figure 3. The surface brightness
distributions of bulge (upper) and
disk (lower) components. The vertical dashed line shows the expected
surface brightness for spheriods at L*
(MB |
 - 19.6 mag)
and the dotted curve the Freeman distribution for disks systems. The
shaded regions show the approximate selection boundaries. (lower) as
above but for the disk components.
- 19.6 mag)
and the dotted curve the Freeman distribution for disks systems. The
shaded regions show the approximate selection boundaries. (lower) as
above but for the disk components.