


To understand the nature of the BBB we first need to determine its SED and thus determine its strength compared to the AGN's SED. Although this task seems relatively simple, there are a lot of observational problems. One of the most important problems is that a substantial part of the BBB in any particular source is in the unobservable part of the electromagnetic spectrum (13.6 eV - 0.1 keV), where it is hidden by Galactic absorption. Therefore, the characteristics of this region need to be inferred from theoretical considerations. In the optical/UV wavelength region, where AGNs can be observed, the spectra have the characteristic strong broad emission lines whose wings make assignment of "line-free continuum" regions very difficult. Further, the Balmer continuum and the many blended Fe II emission lines produce a relatively smooth feature in the AGN spectrum that also has to be accounted for in the continuum fitting process (Wills, Netzer, & Wills 1985). Thus, in this section we discuss the shape of the BBB by considering the optical/UV region and the far-UV/soft X-ray regions separately. We also discuss in detail the observational caveats in each spectral region. We will often discuss composite spectra that have been generated by co-adding several hundred optical/UV spectra in the AGN rest frame. These composites serve as a high signal-to-noise ratio reference to the "observed" AGN shape, because although individual AGN spectra differ in detail, they all have similar characteristic features. It is important to remember, however, that a composite spectrum really has no physical meaning, and models must be fitted to spectra of individual sources.
3.1.1. The Optical to UV Region
The median optical to UV continuum slope in radio-quiet QSOs is

 -0.32
(F
-0.32
(F
 ;
Francis et al. 1991).
The slope was determined in the 1300-5500 Å region after the Balmer
continuum and the Fe II line emission were
accounted for in the continuum fitting process. Using International
Ultraviolet Explorer (IUE) data,
O'Brien, Gondhalekar,
& Wilson (1988)
found that the rest-frame UV slope (1200-1900 Å) is slightly
steeper than the optical and that higher luminosity objects have flatter
slopes than lower luminosity objects. The rest-frame UV slope (1050-2200
Å) from HST data is -0.99
(Zheng et al. 1997).
It must be noted here that there is substantial scatter in the slopes of
the individual objects, yet the optical/UV continuum is redder than the
long wavelength prediction of stationary accretion disk models.
;
Francis et al. 1991).
The slope was determined in the 1300-5500 Å region after the Balmer
continuum and the Fe II line emission were
accounted for in the continuum fitting process. Using International
Ultraviolet Explorer (IUE) data,
O'Brien, Gondhalekar,
& Wilson (1988)
found that the rest-frame UV slope (1200-1900 Å) is slightly
steeper than the optical and that higher luminosity objects have flatter
slopes than lower luminosity objects. The rest-frame UV slope (1050-2200
Å) from HST data is -0.99
(Zheng et al. 1997).
It must be noted here that there is substantial scatter in the slopes of
the individual objects, yet the optical/UV continuum is redder than the
long wavelength prediction of stationary accretion disk models.
3.1.2. The Far-UV to Soft X-Ray Region
Historically, because a substantial part of this wavelength region is unobservable, there have been two approaches to inferring the BBB shape. In the first approach, the BBB continuum was associated with thermal emission from an accretion disk (Shields 1978; Malkan 1983; Kolykhalov & Sunyaev 1984). In the second approach, the shape of the BBB was obtained by comparing photoionization model predictions with observed emission-line strengths (Mathews & Ferland 1987). Both these approaches indicated that the BBB is energetically very important, peaking in the extreme UV and usually dominating the quasar luminosity (MacAlpine 1981; Czerny & Elvis 1987; Mathews & Ferland 1987; Sun & Malkan 1989; Shields 1989; Laor 1990; Bechtold et al. 1994; Walter et al. 1994).
The two recent HST and Roentgen Satellite (ROSAT) investigations by Zheng et al. (1997) and Laor et al. (1997), respectively, allow us to investigate observationally the "observed" shape of the BBB in the 13.6 eV-1 keV region of the continuum. The UV composite spectrum of Zheng et al. was compiled using HST Faint Object Spectrograph (FOS) observations. This sample contained quasars with mean redshifts ~ 1, which allowed determination of the UV composite spectrum in the rest wavelength range ~ 300-3000 Å (see Fig. 2). The individual spectra in the composite have been corrected for Galactic reddening and intergalactic absorption. The UV composite spectrum of AGNs does not appear to rise to shorter wavelengths but seems to roll over shortward of 1000 Å. Laor et al. (1997) produced a composite soft X-ray spectrum of a complete sample of low redshift quasars using ROSAT Position Sensitive Proportional Counter (PSPC) observations. The soft X-ray data seem to be just an extension of the UV composite spectrum (see Fig. 3). If taken at face value, the UV and X-ray composite spectra indicate that the BBB may not be as energetically dominant as thought previously. Further, the peak of the "observed" BBB does not seem to be in the extreme-UV (100-800 Å) but rather in the far-UV region (900-1100 Å).
 |
Figure 2. UV composite spectrum compiled
using HST / FOS observations. The individual spectra in the
composite have been corrected for Galactic reddening and intergalactic
absorption. Note that the composite spectrum does not appear to rise to
shorter wavelengths but seems to roll over shortward of 1000
Å. The 1050-2200 Å region can be fitted by a power-law
continuum
F |
 |
Figure 3. Composite "observed" optical-soft X-ray spectrum for AGNs. The composite UV spectra for radio-loud (RL) and radio-quiet (RQ) objects are plotted as a thin solid line. The thick solid lines represent the optical and soft X-ray composite spectra. The dotted line is the spectral shape predicted by Mathews & Ferland (1987), while the dashed line shows a simple power-law model (not an accretion disk) with a thermal cutoff corresponding to T = 5.4 × 10⁵ K. The data suggest that the far-UV power-law extends into the soft X-ray regime. The 0.2-2.0 keV spectral slope is much flatter than predicted by the simplest thin accretion disk models, which have exponential cutoffs in this wave band (courtesy A. Laor). |
There are a number of observational issues that can affect the observed shape of the BBB. These issues should especially be kept in mind when considering the shape of the BBB, as determined by the UV and X-ray composite spectra, because they affect each individual object in a different manner and thus possibly create an unphysical effect in the composite spectrum. Below we discuss the various issues in detail.
Host galaxy contamination. - The optical/UV region of an AGN spectrum is also where stars put out most of their radiation. Thus careful galaxy subtraction is necessary if we are to determine the shape of the BBB accurately. In low-redshift AGNs, such corrections are often made by subtracting with galaxy bulge template spectra. However, this may be inadequate because the correction does not effectively correct for a starburst population. HST imaging observations of Seyfert galaxies show that nuclear star formation is often occurring well within 0".5 - 1".0 of the nucleus. Depending on the dominance of these star-forming regions, they can contribute substantially toward the optical/UV light that is seen in most ground-based apertures. A comparison of contemporaneous HST and ground-based spectroscopy of NGC 7469 clearly shows this problem (see Figs. 4 and 5). In this particular object, ~ 70% of the starlight falls within 0".1 of the nucleus! For ground-based observations, this problem is exacerbated owing to effects of seeing. Although nuclear starbursts are likely to be present in the host galaxies of high-luminosity AGNs (QSOs), more than 80% of the radiation is from the QSO. Therefore for these objects we do not expect substantial contamination in the optical/UV region from the host galaxy.
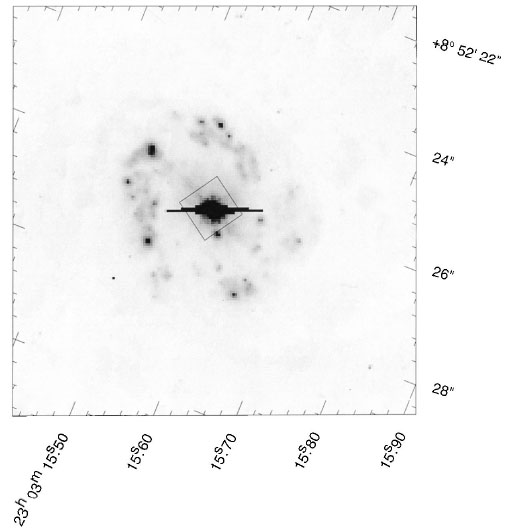 |
Figure 4. The HST Wide Field Planetary Camera 2 image of the nuclear region of NGC 7469. The 3" diameter starburst ring is clearly visible. The nucleus of the galaxy is saturated in this image. Note that in a ground-based slit spectrum, depending on the slit (usually 1" in width) orientation, the ring contaminates the spectrum. Further, such rings would also have contaminated the UV spectra obtained by IUE whose aperture was 10" × 20". The square represents the 0".86 square FOS aperture (courtesy W. Welsh). |
 |
Figure 5. Comparison of the contemporaneous HST / FOS (lower curve) and ground-based spectroscopy of NGC 7469. The HST / FOS spectrum is through a 0".86 square aperture, while the ground-based spectroscopy is mostly through a 10" × 16".8 slit (similar in size to the IUE large-aperture data). The estimated host galaxy contamination is ~ 18% at 5400 Å, which we see in the figure is highly underestimated. The gross difference between the HST / FOS and ground-based fluxes is due to the host galaxy and starburst ring contribution in the ground-based spectrum. This figure highlights the value of high spatial resolution spectroscopy (courtesy W. Welsh). |
Intrinsic reddening. - Intrinsic reddening in the AGN plays an important role when determining the optical/UV continuum. It is generally assumed that the intrinsic reddening in AGNs is small [E(B - V) = 0.05-0.1 mag], independent of the reddening law. Although this small amount of reddening does not affect the optical fluxes dramatically, it has a dramatic effect at UV wavelengths. This reddening correction becomes extremely crucial for high-z AGNs since the reddening correction is applied to the far-UV rest wavelengths. Thus applying a reddening correction, even a very small one, can effectively change the shape of the observed BBB spectrum.
In most analyses the continuum is corrected for Galactic reddening, and there may sometimes be an attempt to correct for intervening intergalactic absorption. An attempt to correct for intrinsic reddening via line ratios is also often made, but depending on the line ratios, one can get significantly differing amounts for the correction. In addition, the reddening might be different for the line- and continuum-emitting regions. A systematic analysis of the reddening indicators and effects of dust in multiwavelength spectra needs to be undertaken, especially now that we have mounting evidence for dust in the nuclei of AGNs (Malkan, Gorjian, & Tam 1998).
The UV composite spectrum generated by Zheng et al. (1997) has a spectral break at 1000 Å. Could this prominent continuum feature be due to inaccurate corrections for intrinsic reddening in each individual AGN? Laor & Draine (1993) have shown that dust opacity peaks at ~ 700-800 Å and drops sharply at shorter wavelengths. If the far-UV spectral slope change in the Zheng et al. spectrum was due to dust, then below 700 Å the composite spectrum should have "recovered" by 400 Å. Such a change in continuum slope is not seen, which indicates perhaps that the effects of intrinsic dust reddening are not important. However, it must be noted that the far-UV spectral region of the composite has few objects contributing to the spectrum. These objects are at high redshifts, and their continua have been statistically corrected for intervening intergalactic absorption (for clouds with NH < 1016 cm-2), and additional corrections if the objects were known to have intervening absorption systems.
In an individual spectrum, reddening will not cause a spectral break at 1000 Å but will just change the slope of the spectrum dramatically at these short wavelengths. In fact, because of the composite nature of the spectrum, it may be possible that the spectral break is prominent owing to incorrect reddening corrections in each of the individual spectra that extend over limited regions of the entire wavelength range of the composite. Notwithstanding the above observational caveats, the incidence of the spectral break at 1000 Å, so close to the Lyman limit, is tantalizingly suggestive of an intrinsic emission mechanism as the cause.
Extreme-UV energy distribution. - As mentioned earlier, to understand the primary emission mechanism in AGNs, it is crucial to know the shape of the BBB in the extreme-UV (EUV). We have to determine if the UV composite truly represents the EUV SED in AGNs. At wavelengths less than 800 Å, only a few objects are contributing toward the UV composite of Zheng et al. (1997). There are very few observations of AGNs in this region that can be used for a quantitative analysis of the EUV energy distribution. For both Seyfert galaxies and QSOs, there are individual objects in which the BBB SED is not similar to that derived from the UV and X-ray composite spectra (e.g., HS 1700+6416, HS 1103+6416, and HE 2347-4342 from Reimers et al. 1998; PG 1211+14; Zheng et al. 1999). Figure 6 shows the far-UV and EUV SED in luminous AGNs. The variety of the EUV SEDs indicate that describing the BBB with simple models will not be possible and that the task is much more complex, and the SED at these short wavelengths needs to be quantified better.
 |
Figure 6. Spectral energy distributions for
four high-redshift QSOs detected in the Hamburg quasar survey. The
spectra are shown in the rest frame of the quasar. The UV continua
derived for the dereddened spectra have been corrected for H I continuum absorption of the Lyman limit systems. An
additional correction for the cumulative H I
continuum absorption of
Ly |
Soft X-ray issues. - The soft X-ray excess component in AGNs is important for the evaluation of accretion disk models because it is often interpreted as the high-energy tail of the BBB and it helps determine the total energy emitted in the BBB. There are a number of spectral components that contribute to the X-ray excess region (0.1 to ~ 1 keV), including the underlying X-ray power law and the "warm absorber" (absorption in the 0.5-1.5 keV range dominated by O VII and O VIII K-shell absorption edges in material with NH ~ 1022 cm-2). All these spectral components complicate the theoretical interpretation of this region. A detailed analysis of ASCA data by George et al. (1998) challenges the presence of the soft X-ray excess in some objects, and recent BeppoSAX data fail to show a soft X-ray excess in many sources in which such an excess was claimed to exist before (Matt 1998). The presence of a warm absorber in Seyfert galaxies and the lack of warm absorbers in high-luminosity AGNs has lead to some extent to more observational uncertainty.
To add to the modeling difficulties, simultaneous data obtained with ASCA and ROSAT showed different slopes in the 0.2-1 keV bands. The soft X-ray slopes observed by Laor et al. (1997) need to be verified because there have been observational issues concerning the accuracy of the ROSAT PSPC calibration matrix, especially at low flux levels (which is obviously the case for X-ray observations of AGNs). However, the H I columns determined by Laor et al. agree remarkably well with the accurate 21 cm H I columns, which suggests that the ROSAT PSPC calibration matrix may be quiet reliable.
It is difficult to compare the ROSAT and ASCA
observatories. ASCA cannot observe the soft X-rays
( 0.6 keV) and has
a broad wave band (0.4-10 keV) and high energy resolution, while the
ROSAT PSPC observed soft energies (0.1 keV) but did not have a
broad wave band or high energy resolution. The presence of numerous
spectral components and their relative contributions at various energy
bands further complicates comparisons between the two
observatories. Thus, interpretation of the soft X-ray excess depends on
our understanding of the broader X-ray wave band.
0.6 keV) and has
a broad wave band (0.4-10 keV) and high energy resolution, while the
ROSAT PSPC observed soft energies (0.1 keV) but did not have a
broad wave band or high energy resolution. The presence of numerous
spectral components and their relative contributions at various energy
bands further complicates comparisons between the two
observatories. Thus, interpretation of the soft X-ray excess depends on
our understanding of the broader X-ray wave band.
Sample consistency. - The UV X-ray composite shown in Figure 3 is based on two different samples. The far-UV composite is based mainly on quasars with z > 1, while the soft X-ray composite is based exclusively on quasars with z < 0.4. Thus, if the quasar SED evolves with z, it may be misleading to combine the SED of high- and low-z samples. One clearly needs to measure the far-UV and soft X-ray continuum for the same population of quasars in order to establish the shape of the BBB.
 16 cm-2 is
indicated by the dotted lines. We see that each of these AGNs show
dramatically different EUV distributions (courtesy D. Reimers).
16 cm-2 is
indicated by the dotted lines. We see that each of these AGNs show
dramatically different EUV distributions (courtesy D. Reimers).