


SSPs are defined as stellar populations whose star formation duration is short in comparison with the lifetimes of its most massive members. They are considered the simplest stellar systems and the fundamental building blocks of more complex starburst galaxies. While SSPs are idealized entities, Galactic OB associations (Massey 2003), giant H II regions (González Delgado & Pérez 2000), and super star clusters (SSC; Origlia et al. 2001) have been demonstrated to resemble SSPs rather closely. By testing the stellar clocks in the simplest of all laboratories, we can identify the most suitable age tracers in the absence of secondary parameters. The evolution of the optical spectrum as predicted by the synthesis models of González-Delgado et al. (2004) is reproduced in Fig. 2. These synthetic population spectra make use of the library of Martins et al. (2004) introduced before. The purpose of this figure is to highlight similarities and differences between two widely used evolution models. While there is overall agreement, noticeable differences exist around 10 Myr and after 1 Gyr when RSGs and red giants are important, respectively. Vázquez & Leitherer (2004) discuss the sources of these differences. In the following, I will briefly highlight useful age discriminants as they appear over the first ~ 100 Myr in the evolution of a SSP.
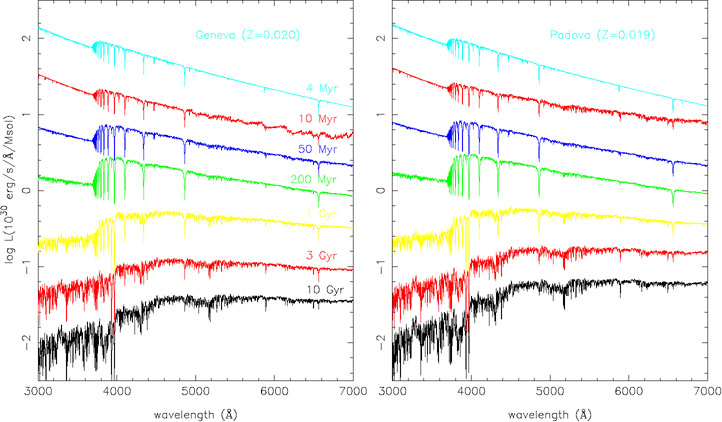 |
Figure 2. Theoretical spectral evolution of a SSP with solar composition predicted by the Geneva (Schaller et al. 1992; left) and the Padova (Girardi et al. 2000; right) models. Ages from top to bottom are 4 Myr, 10 Myr, 50 Myr, 200 Myr, 1 Gyr, 3 Gyr, and 10 Gyr (González-Delgado et al. 2004). |
1 Myr: obscured star formation. The first 1 to 2 Myr after the stellar birth are inaccessible to detailed age-dating because of dust obscuration. The youngest, optically identified Galactic OB associations have ages > 1 - 2 Myr (Massey et al. 1995), which is generally interpreted as evidence for strong obscuration at earlier ages. A "radio supernebula" in the nearby dwarf irregular NGC 5253 may be a starburst caught close to the act of formation (Turner & Beck 2004). Images of the 7 mm free-free emission reveal structure in the nebula, which has a 1 pc core requiring the excitation of ~ 103 O7 stars. The total ionizing flux within the central 20 pc is 7 × 1052 s-1, corresponding to 7000 O7 stars. This cluster is the dominant ionizing source in NGC 5253, yet it is totally obscured at optical wavelengths.
4 Myr: UV stellar-wind lines. The wavelength region between
1200 Å and 2000 Å is dominated by stellar-wind lines of, e.g.,
C IV  1550 and
Si IV 1400, the strongest
features of hot stars in a young population (e.g.,
Leitherer et al. 1995;
2001).
In contrast, the optical and IR spectral
regions show few, if any, spectral signatures of
hot stars, both due to blending by nebular emission and the general
weakness of hot-star features longward of 3000 Å. Hot-star winds are
radiatively driven, with radiative momentum being transferred into
kinetic momentum via absorption
in metal lines, like those observed in the satellite-UV. Since the
stellar far-UV radiation field softens with time
for an evolving SSP, the wind strength decreases, and the lines
change from being P Cygni wind profiles during the first few Myr to
purely photospheric absorption lines after about 10 Myr. This is illustrated
in Fig. 3, which compares the UV spectra of two
SSCs in the Antennae
(NGC 4038/39) to a theoretically calculated age sequence. At
early age,
C IV and Si IV display P Cygni profiles, followed by a gradual weakening
due to the changing wind density and
ionization conditions. An important application of this method is at
redshift > 2, where the restframe-UV
becomes accessible to large ground-based telescopes
(Pettini et al. 2000).
1550 and
Si IV 1400, the strongest
features of hot stars in a young population (e.g.,
Leitherer et al. 1995;
2001).
In contrast, the optical and IR spectral
regions show few, if any, spectral signatures of
hot stars, both due to blending by nebular emission and the general
weakness of hot-star features longward of 3000 Å. Hot-star winds are
radiatively driven, with radiative momentum being transferred into
kinetic momentum via absorption
in metal lines, like those observed in the satellite-UV. Since the
stellar far-UV radiation field softens with time
for an evolving SSP, the wind strength decreases, and the lines
change from being P Cygni wind profiles during the first few Myr to
purely photospheric absorption lines after about 10 Myr. This is illustrated
in Fig. 3, which compares the UV spectra of two
SSCs in the Antennae
(NGC 4038/39) to a theoretically calculated age sequence. At
early age,
C IV and Si IV display P Cygni profiles, followed by a gradual weakening
due to the changing wind density and
ionization conditions. An important application of this method is at
redshift > 2, where the restframe-UV
becomes accessible to large ground-based telescopes
(Pettini et al. 2000).
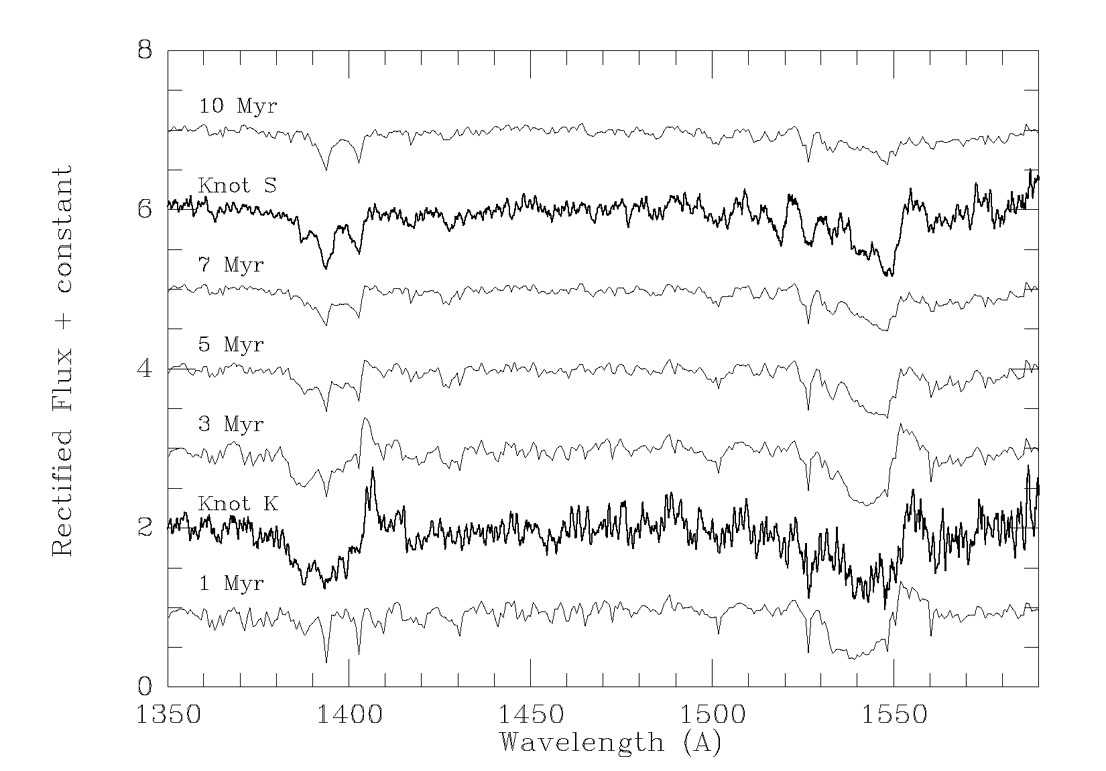 |
Figure 3. Comparison between the observed UV spectra of two SSCs in the Antennae (thick lines) and model spectra (thin lines) based on evolutionary population synthesis from Starburst99 (Whitmore et al. 1999). |
4 Myr: nebular emission lines. Young stellar systems are embedded
in gas. If O, B, and W-R stars are present,
the gas will be ionized and excited. Analysis of electron-temperature
sensitive lines in the optical and fine-structure lines in the mid-IR
allows an independent determination of the stellar
heating, and therefore of the stellar far-UV radiation field and its
evolution with time. The age range for which this technique is sensitive
coincides with the
evolutionary timescale of O stars, i.e., ~ 10 Myr for a SSP.
Evolutionary synthesis calculations coupled to photoionization models
predict strong variations of the far-UV radiation field, in particular
when hot stars with strong winds appear (e.g.,
Smith et al. 2002).
Different models seem to converge in
their predictions and with observations longward of the He° edge, but
discrepancies exist around and below the He+ edge. The equivalent
widths of the strongest hydrogen recombination lines, such as
H ,
H
,
H ,
or Br
,
or Br can
be very powerful age indicators
(Stasinska &
Leitherer 1996)
because they measure the ratio of the young, ionizing over the
old, non-ionizing population. In practice, their interpretation is
complicated by reddening affecting the nebular emission and the stellar
continuum differently and by underlying older populations diluting the
continuum.
can
be very powerful age indicators
(Stasinska &
Leitherer 1996)
because they measure the ratio of the young, ionizing over the
old, non-ionizing population. In practice, their interpretation is
complicated by reddening affecting the nebular emission and the stellar
continuum differently and by underlying older populations diluting the
continuum.
10 Myr: near-IR features from RGSs. After about 5 Myr, the most massive stars of a single population evolve toward cooler temperatures forming RSGs. The RSG continuum and lines will dominate the red and near-IR for the following tens of Myr. Since RSG wind densities and surface gravities are orders of magnitude lower than in their hot evolutionary progenitors, narrow (~ 2 km s-1) photospheric lines and the CO bandhead at 2.3 µm can be observed in individual stars. In star clusters, these lines allow a velocity dispersion measurement, and therefore a determination of the cluster mass (Lehnert, this conference). Most RSG features are quite age sensitive because of their temperature dependence, and their anticorrelation with nebular emission lines permits studies of age gradients and propagating star formation among H II regions (Ryder et al. 2001). Unfortunately, these lines often exhibit a strong gravity dependence as well. Therefore, contributions from less luminous - but more numerous - giant stars must be carefully evaluated in more complex populations (Rhoads 1998). The shift in wavelength of age-sensitive lines from the UV to the IR that occurs with the appearance of RSGs has an added benefit: obscured clusters can be observed with attenuation factors reduced by an order of magnitude relative to the V band.
25 Myr: isochrone analysis of B stars. The color-magnitude diagram (CMD) is the tool of choice for studying the star-formation history systems which are resolved into stars and whose colors are age sensitive (the latter is not the case for O stars). Deep CMDs contain stars born over the whole mass range and can be used to derive ages from, e.g., the main-sequence turn-off (Aparicio & Gallart 2004). Given the information density in an observed CMD, an isochrone analysis is powerful enough to provide not only the age of the population but at the same time also the chemical composition, the cluster mass, and the stellar initial mass function). This method relates the number of stars populating different regions of the observational CMD to the density distribution of stars in the CMD as a function of age, mass, and metallicity as predicted by the stellar evolution theory. NGC 330, a rich cluster in the LMC, has become an often used test case for models (e.g., Keller et al. 2000). It has a well-defined turn-off dominated by B stars, as well as a significant RSG population which provides constraints on the evolved population. Its turn-off age is 25 ± 5 Myr. NGC 330 serves as an example that nature can be more complex than standard evolution models: rapid rotators have been identified to produce a population of overluminous B stars contaminating the main-sequence turn-off (Grebel et al. 1996). While these stars can easily be accounted for in the CMD, they would skew the age estimate towards younger ages if integrated photometry or spectroscopy of the cluster were taken.
25 Myr: shock-sensitive lines. A few percent of the total
radiative stellar luminosity of a young population
is converted into mechanical luminosity via stellar winds and supernovae.
Integrated over their lifetimes, the energy release by stellar winds is
comparable to that of a supernova event: Mass-loss rates of about
10-5
M yr-1 and wind velocities on the order of
103 km s-1 result in mechanical energies around
1051 erg over 107 yr
(Leitherer et
al. 1999).
The non-thermal energy input is traced, e.g., by
[Fe II] 1.26
µm and
1.64 µm,
which are often observed in evolved
starbursts and can be used to age-date population
(e.g., Calzetti 1997;
Dale et al. 2004).
Under normal conditions, Fe is
a refractory element locked in grains and therefore highly depleted. The
appearance of strong [Fe II] lines can be understood in terms of
an increased gas-phase abundance of Fe due to grain destruction in
shocks
(Forbes & Ward
1993).
yr-1 and wind velocities on the order of
103 km s-1 result in mechanical energies around
1051 erg over 107 yr
(Leitherer et
al. 1999).
The non-thermal energy input is traced, e.g., by
[Fe II] 1.26
µm and
1.64 µm,
which are often observed in evolved
starbursts and can be used to age-date population
(e.g., Calzetti 1997;
Dale et al. 2004).
Under normal conditions, Fe is
a refractory element locked in grains and therefore highly depleted. The
appearance of strong [Fe II] lines can be understood in terms of
an increased gas-phase abundance of Fe due to grain destruction in
shocks
(Forbes & Ward
1993).
30 Myr: Balmer absorption lines. The spectra of early-type stars are characterized by strong hydrogen Balmer and neutral helium absorption lines (Walborn & Fitzpatrick 1990). However, the detection of these stellar features at optical wavelengths in the spectra of young starbursts is difficult because H and He I absorption features are coincident with the nebular emission lines that mask the absorption features. Once the starburst is old enough for ionizing radiation to be negligible, the stellar H and He absorption lines become a useful diagnostic. The strength of the Balmer absorption lines is strongly age dependent. The equivalent widths increase with age until about a few hundred Myr when the stellar population is dominated by early-A type stars; they range between 2 and 16 Å if the cluster is formed at solar metallicity. An application of this method is in Fig. 4 where the synthetic models of González Delgado et al. (2004) are used to determine ages of star clusters in the LMC. The advantages of using Balmer and He I lines in absorption to date starbursts with respect to using nebular emission lines are twofold: (i) the age can be constrained over a much wider range, and (ii) the strengths of the absorption lines are not affected by extinction (but see the following section) or by the leaking of ionizing photons.
 |
Figure 4. Intermediate-resolution spectra of the three LMC clusters NGC 1818 (bottom panel), NGC 1831 (center), and NGC 1846 (top) compared with theoretical spectra computed by González Delgado et al. (2004). The models are the upper spectra in each panel. The cluster ages are literature values, whereas the model ages are derived from the best-fit model. |
30 Myr: optical and near-IR colors. Colors are the prime age
indicators in intermediate and old stellar populations. Reddening and
the optical color degeneracy of hot stars limit their use to
ages of more than about 30 Myr. There is very little metallicity dependence
in young systems due to the lack of strong metal lines in the optical and
near-IR. Metallicity does enter via evolution models when RSGs affect the
colors (between 10 and 50 Myr). However, as I will discuss below, this
particular model prediction is often incorrect due to wrong RSG
parameters in stellar evolution models for metal-poor populations.
The main challenge in interpreting colors of young systems is to break the
age-reddening degeneracy. The reddening vector is parallel to the
isochrones in most color-color diagrams, and the reddening correction
uncertainty is often much larger than the desired precision of the age
determination. Reddening corrections are not only an issue
for interpreting colors but also for recombination-line equivalent
widths (e.g.,
H), as the
obscuration of stars and gas is not the same in a young population
(Calzetti 2001).