


The far-UV spectrum of the archetypal starburst galaxy M83 is reproduced in Fig. 1
(Leitherer et
al. 2002).
The wavelength region shown covers 900 - 1200 Å, where blanketing
is most severe. M83 has supersolar oxygen abundance. Therefore,
line-blanketing effects due to stellar-wind, stellar photospheric, and
interstellar lines are particularly strong in this galaxy. The stellar
features generally originate from higher ionization stages than the
features found above 1200 Å. The most prominent transition is the
O VI resonance doublet at 1032,38 Å, which displays a spectacular
P Cygni profile over a broad range of spectral types. At the resolution
afforded by FUSE, the blueshifted absorption component of the P Cygni
profile is resolved from nearby
Ly- and can
be distinguished from the narrow interstellar
C II at 1036 Å. The (redshifted) emission component of its P
Cygni profile is relatively unaffected by interstellar lines and
provides additional diagnostic power. The C III 1176 line is at the
long-wavelength end of the covered spectral range and can also be
observed with spectrographs optimized for wavelengths longward of
Ly-
and can
be distinguished from the narrow interstellar
C II at 1036 Å. The (redshifted) emission component of its P
Cygni profile is relatively unaffected by interstellar lines and
provides additional diagnostic power. The C III 1176 line is at the
long-wavelength end of the covered spectral range and can also be
observed with spectrographs optimized for wavelengths longward of
Ly- . Surprisingly, the
line has received relatively little attention in the earlier literature
although it is a very good diagnostic of the properties of hot
stars. C III is not a resonance transition, and consequently does
not suffer from contamination by an interstellar component. C III,
like most other stellar lines, has a pronounced metallicity dependence,
either directly via opacity variations, or indirectly via
metallicity-dependent stellar-wind properties.
. Surprisingly, the
line has received relatively little attention in the earlier literature
although it is a very good diagnostic of the properties of hot
stars. C III is not a resonance transition, and consequently does
not suffer from contamination by an interstellar component. C III,
like most other stellar lines, has a pronounced metallicity dependence,
either directly via opacity variations, or indirectly via
metallicity-dependent stellar-wind properties.
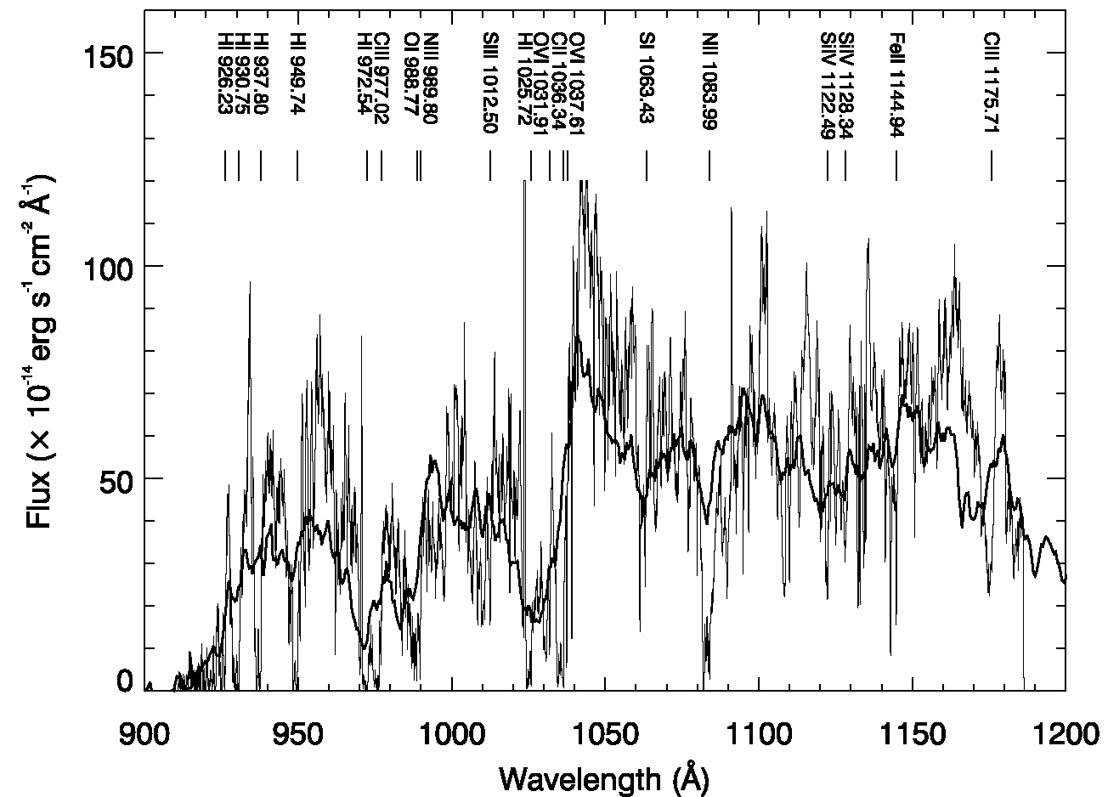 |
Figure 1. Spectral region between 900 and 1200 Å for M83 (= NGC 5236). Major lines are labeled. Thick line: HUT; thin: FUSE (Leitherer et al. 2002). |
Quantitative modeling of the stellar far-UV lines by means of evolutionary synthesis was done by Robert et al. (2003). In Fig. 2 I show an evolutionary sequence based on an empirical FUSE library of hot stars (Pellerin et al. 2002). The computed spectra are a good match to the M83 spectrum in Fig. 1. The C III 1176 line is an excellent age diagnostic mirroring the behavior of the well-studied Si IV 1400 line: when luminous supergiants appear around 3 Myr, wind recombination raises the emission flux (Leitherer et al. 2001). The O VI line, in contrast, is largely decoupled from stellar parameters over a wide range of ages. This line is powered by shock heating and remains constant for stellar temperatures above ~ 30,000 K. Combining lines with different optical depths, excitation, and ionization parameters allows age and metallicity estimates from far-UV spectra analogous to methods calibrated at longer wavelengths (e.g., Keel et al. 2004).
 |
Figure 2. Evolution of a synthetic far-UV spectrum following a Salpeter IMF between 0 and 10 Myr. Stellar features (bottom), H2 lines (top), and other interstellar absorptions (top; vertical dotted lines) are labeled. The emission line at 1026 Å is geocoronal (Robert et al. 2003). |
Apart from their sensitivity to metallicity, the far-UV lines are affected the well-known age vs. initial mass function (IMF) degeneracy. In the absence of additional constraints, age and IMF can always be traded. This applies to the far-UV continuum as well, which in addition suffers from an age-reddening degeneracy. In contrast to wavelengths above 1200 Å, the intrinsic stellar spectra below 1200 Å are outside the Rayleigh-Jeans regime, and age effects are no longer negligible for the continuum slope generated by an instantaneous population. Alternatively, for a population of continuously forming stars, the region between 912 and 1200 Å becomes even less age sensitive to population variations than the near-UV, because an equilibrium between star formation and stellar death is reached earlier in time (see Leitherer et al. 1999). Ages and star-formation rates in starburst galaxies derived from far-UV spectra are consistent with the results from longer wavelengths.