


4.2. Photometric Redshifts
Lyman-break and Lyman-forest methods are just two examples of
photometric redshift determinations, in which galaxy redshifts are
estimated using multiband photometric information. The idea has a long
history, dating back to
Baum (1962)
who used nine-band photoelectric data to estimate galaxy cluster
redshifts.
Koo (1985),
analyzing four-band photographic data, showed that isoredshift contours
on color-color plots provide reliable photometric redshift
estimates. Recently, photometric techniques have enjoyed a revival,
largely catalyzed by the deep photometry of the HDF and the new
generation of large-format CCD arrays. The typical redshift uncertainty
for the photometric methods is expected to be in the range of
 z =
0.05-0.10. This accuracy is sufficient for many scientific goals, such
as luminosity function determinations, luminosity density
determinations, and projected correlation function analyses. The
technique is also efficient for identifying unusual sources, such as
distant galaxies, quasars, and galaxy clusters, which can then be
targeted for detailed spectroscopic study.
z =
0.05-0.10. This accuracy is sufficient for many scientific goals, such
as luminosity function determinations, luminosity density
determinations, and projected correlation function analyses. The
technique is also efficient for identifying unusual sources, such as
distant galaxies, quasars, and galaxy clusters, which can then be
targeted for detailed spectroscopic study.
Several teams are actively pursuing photometric redshift determinations, and the HDF (recently augmented by the HDF-South) has been an excellent laboratory for validating the technique (cf. Hogg et al. 1998). Table 3 lists some of the primary working groups with brief commentary on their technique. Figure 6, comparing spectroscopic redshifts in the HDF with photometric redshift determinations by the Stony Brook group, illustrates the robustness of photometric redshift determinations. A recent review of photometric redshifts is presented in Yee (1998).
| Group | Technique | Reference |
| Berkeley... | Bayesian analysis with empirical spectral templates | 1 |
| Imperial College... | Synthetic spectral templates | 2 |
| Johns Hopkins... | Empirical fit to four-dimensional flux space | 3 |
| Princeton... | Empirical fit to three-dimensional color space | 4 |
| Stony Brook... | Hybrid spectral templates | 5 |
| Toronto... | Hybrid spectral templates | 6 |
| Victoria... | Synthetic and empirical spectral templates | 7 |
REFERENCES. - (1) Benítez 1999; (2) Mobasher et al. 1996; (3) Connolly et al. 1995, 1997; Brunner et al. 1997; (4) Wang et al. 1998; (5) Lanzetta et al. 1996; Fernàndez-Soto et al. 1999; (6) Sawicki et al. 1997; (7) Gwyn & Hartwick 1996. |
||
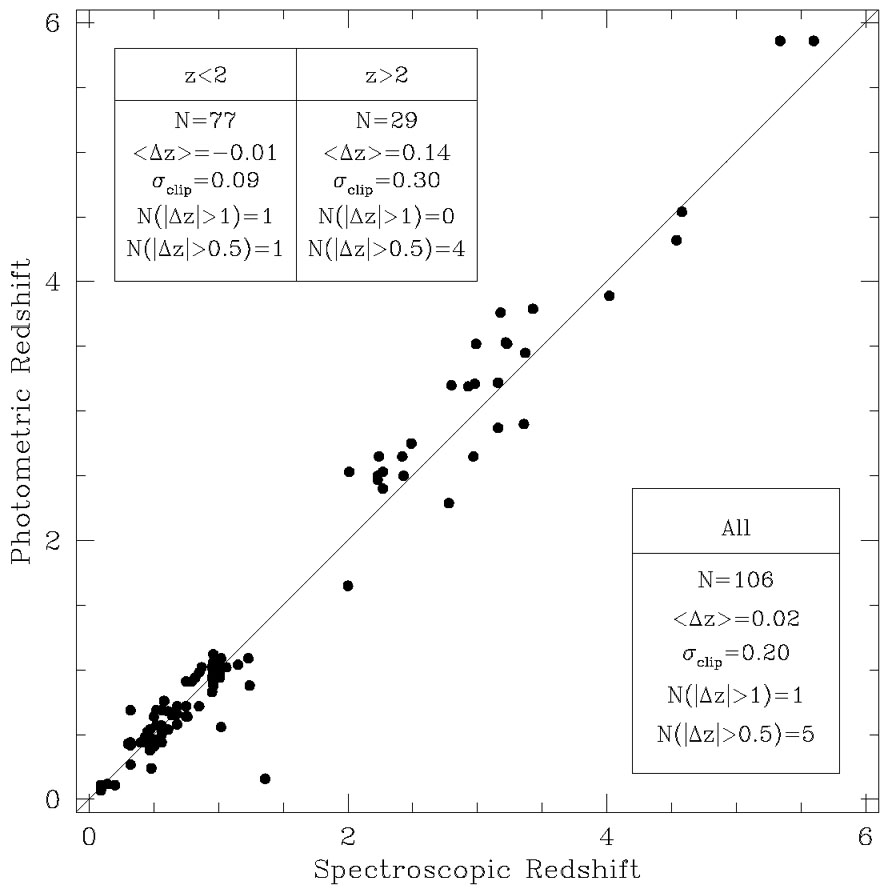 |
Figure 6. A comparison of spectroscopic and
photometric redshifts in the (Northern) HDF. Photometric redshifts are
from the Stony Brook group, as detailed in the text. Spectroscopic
redshifts are from the literature. Insets indicate various comparisons
between the redshift determinations in two redshift bins as well as the
entire sample: N is the number of galaxies,
< |
Contemporary photometric redshift determinations can be divided into two major strategies. The first approach (e.g., Koo 1985; Lanzetta, Yahil, & Fernàndez-Soto 1996; Gwyn & Hartwick 1996; Mobasher et al. 1996; Sawicki, Lin, & Yee 1997; Benítez 1999; Fernàndez-Soto, Lanzetta, & Yahil 1999) involves fitting observed galaxy colors with redshifted spectral templates. These templates may be empirical, synthetic, or hybrid, and may be modified by dust absorption and/or the redshift-dependent opacity of intergalactic hydrogen. Statistical treatments are used to determine a redshift distribution function, generally quoted as a single number corresponding to the peak of the distribution. However, determinations of, for example, galaxy luminosity functions, should retain the photometric redshift distribution function to reliably indicate the uncertainties of the analysis. The other approach (e.g., Connolly et al. 1995, 1997; Brunner et al. 1997; Wang, Bahcall, & Turner 1998) is purely empirical: with a sufficiently large training set, an empirical relation between redshift and observed magnitudes m0 and colors C can be determined, z = z(m0, C).
We detail the method used by the Stony Brook group
(Lanzetta et al. 1996;
Fernàndez-Soto et
al. 1999)
to give some flavor of photometric redshift determinations. They begin
with the four empirical galaxy spectral energy distributions of
Coleman, Wu, & Weedman
(1980),
corresponding to four observed galaxy types (E/S0, Sbc, Scd, and Irr)
and covering the wavelength range 1400-10000 Å. The templates are
extrapolated in the UV to 912 Å using the empirical spectra of
Kinney et al. (1993),
and are extrapolated in the infrared to 25 µm using the
spectral evolutionary models of
Bruzual & Charlot
(1993).
The hybrid templates are redshifted and the redshift-dependent UV
hydrogen absorptions are removed using a model of the optical depth of
hydrogen. At modest redshift, this transmission function is empirically
derived from observations of quasars (e.g.,
Madau 1995).
The shifted, absorbed spectra are then convolved with the transmission
curves of the relevant filters and a redshift likelihood function is
calculated relating the model colors to measured fluxes. Comparisons
between photometric and spectroscopic redshift determinations in the HDF
show that the former is typically robust to
z
 0.34 for objects with
I814 ~ 25.5 and z > 3. Residuals are
typically
zrms
/ (1 + z) 0.1
at all redshifts (see Fig. 6).
0.34 for objects with
I814 ~ 25.5 and z > 3. Residuals are
typically
zrms
/ (1 + z) 0.1
at all redshifts (see Fig. 6).
Other template photometric redshift estimates generally vary in only two considerations: (1) the input spectral templates and (2) the method of determining the best-fit zphot. Input spectral templates may be purely empirical, purely synthetic, or hybrid as in the Stony Brook analysis (see Table 3). Input libraries may also vary in the number of templates. Many groups use the four empirical spectral energy distributions of Coleman et al. (1980). The addition of one or more star-forming galaxy templates, as assembled by Calzetti, Kinney, & Storchi-Bergmann (1994), has been noted to improve the accuracy of the photometric redshift determination by some groups. Determination of the best-fit zphot relies on a statistical analysis. For example, the Stony Brook group uses a maximum likelihood analysis, while Benítez (1999) applies Bayesian marginalization and prior probabilities to the problem.
The training set method has the advantage of being purely empirical, and
therefore not relying on a choice of input templates. However, the
weakness is that the method requires and is dependent upon a large and
accurate input training set. Redshift ranges with sparse numbers of
confirmed redshifts, such as 1
 z
2.5 and z
z
2.5 and z
 4, lead to poorly
determined photometric redshift determinations. The various
practitioners of this technique vary in the degree polynomial used to
fit the multivariate function z = z(m0,
C) and whether or not they implement observed flux as a variable
in the optimal fit.
4, lead to poorly
determined photometric redshift determinations. The various
practitioners of this technique vary in the degree polynomial used to
fit the multivariate function z = z(m0,
C) and whether or not they implement observed flux as a variable
in the optimal fit.
In terms of the current review on search techniques for protogalaxies,
we are most interested in the robustness of these photometric procedures
in identifying the high-redshift (z
4) tail in the
field galaxy redshift distribution.
Fernàndez-Soto et
al. (1999)
find five galaxies brighter than I814 = 26.5 in the
HDF with 4.5 < z < 5.5, corresponding to a surface density
of 1.0 galaxies arcmin-2 (unit-z)-1 at
z = 5. Spectroscopic confirmation of the high-redshift
photometric candidates is necessary to validate the technique before
photometric redshift measurements of, for example, the star formation
history of the early universe are well established. Over the past 3
years, our Berkeley-based group has been using slit masks with the Low
Resolution Imaging Spectrometer (LRIS;
Oke et al. 1995)
on the Keck II telescope to measure faint galaxy spectra in the HDF. We
choose z 4
candidates in collaboration with the Stony Brook-based photometric
redshift group. With the current instrumentation, spectroscopic redshift
measurements are viable perhaps to I814
27.5 for
emission-line sources and to I814
26 for objects
without strong emission lines. But even at I814
25.5, the effort is
fairly "heroic": observations of a single faint galaxy can easily extend
over multiple observing seasons in order to measure a reliable
spectroscopic redshift. Figure 7 presents Keck/LRIS
spectra of three high-redshift sources in the HDF obtained by our
Berkeley-based group. In
Table 4 we list a comparison of spectroscopic and
photometric redshifts for galaxies in the HDF at z > 4.
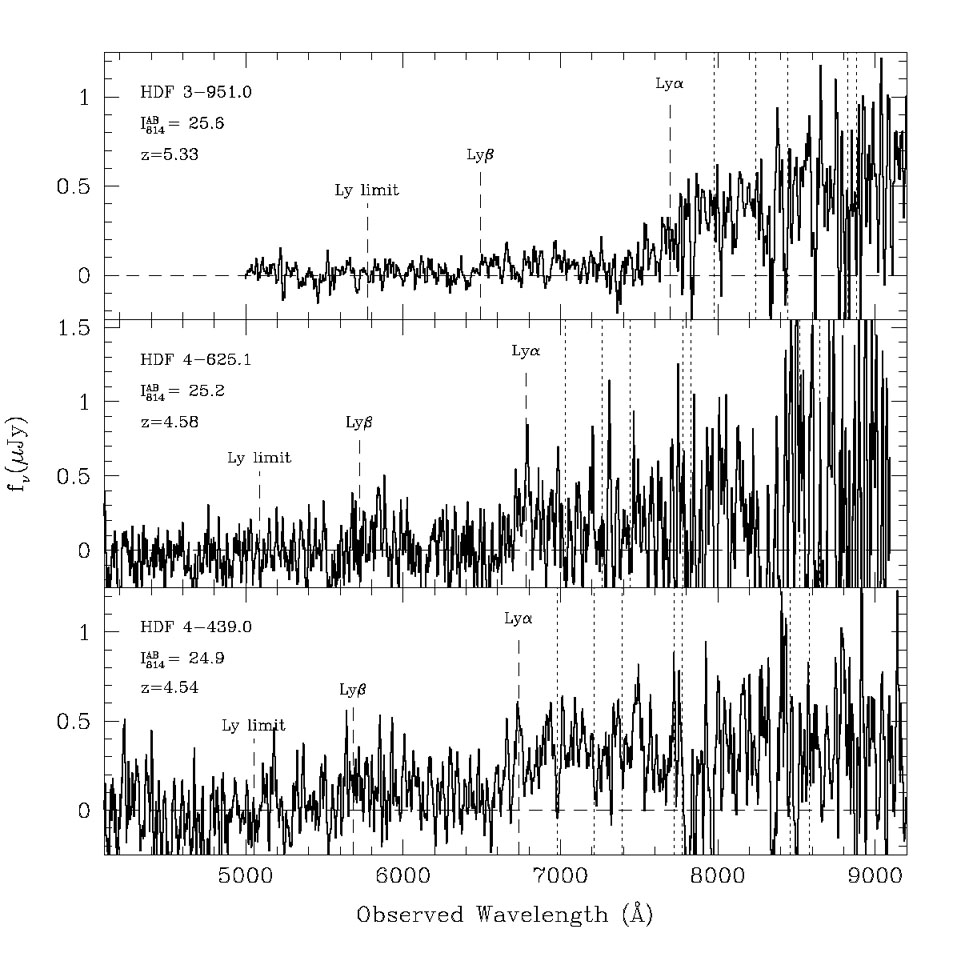 |
Figure 7. Keck/LRIS spectra of HDF 3-951.0,
HDF 4-625.0, and HDF 4-439.0, three photometrically
selected high-redshift galaxies in the HDF. The spectrum of HDF 3-951.0
represents 6 hr of integration with the 150/7500 lines mm-1
grating, significantly more sensitive than the discovery spectrogram
presented in
Spinrad et al. (1998).
The slightly revised redshift of z = 5.33 is based on the
Ly |
| Galaxy | zspec | zphot | WLy obs obs(Å) |
I814 (AB) (mag) |
Reference |
| HDF 3-512.0... | 4.02 | 3.56 | 200 |
25.5 | 1 |
| HDF 4-439.0... | 4.54 | 4.32 | ~ 20 | 24.9 | 2 |
| HDF 4-625.0... | 4.58 | 4.52 | ~ 100 | 25.2 | 2 |
| HDF 3-951.0... | 5.33 | 5.72 | ... | 25.6 | 3 |
| HDF 4-473.0... | 5.60 | 5.64 | ~ 300 | 27.1 | 4 |
NOTES. - Photometric redshift
zphot from
Fernàndez-Soto et
al. 1999.
I814 magnitude from
Williams et al. 1996.
|
|||||
The reliability of the photometric redshifts in the 4
z
5 regime seems
excellent. Even at lower redshifts, only
5% of the photometric
redshifts are noticeably discordant when compared to spectroscopic
redshifts. However, looking ahead, as we push the frontier past z
= 6, the hydrogen absorptions are predicted to almost completely
obliterate the observed optical flux. Deep near-infrared photometry will
be necessary, observations which are best done from space, above the
atmospheric water absorptions and the strong OH emission bands in the
airglow. The NICMOS camera on the Hubble Space Telescope
(HST) has left a valuable legacy of data and the Next Generation
Space Telescope (NGST) is being planned to work long-ward of 1
µm.
 clip is the
clipped dispersion between the measurements, and
N(|
clip is the
clipped dispersion between the measurements, and
N(| discontinuity, which is located at a wavelength less affected by
telluric emission than the
Ly
discontinuity, which is located at a wavelength less affected by
telluric emission than the
Ly 3.
3.