


Stellar kinematics has also been extensively used with the help of sophisticated dynamical models to constrain the mass-to-light ratios of nearby galaxies up to a few effective radii. The apparent simplicity implied by the extension and smoothness of the stellar component is unfortunately accompanied by the potential richness of the corresponding orbital structure. Strong assumptions on the geometry and dynamics of the systems are therefore, and once again, required to progress on this front. Even for simple spherical systems, there is a long known degeneracy between the anisotropy and the mass profile [22]. Sanchis et al. [23] have thus recently emphasised the importance of higher order velocity moments (and more specifically of the even moments) to break this degeneracy. Kronawitter et al. [24] included the velocity dispersion but also the fourth Gauss-Hermite term h4 in their study of a small sample of early-type galaxies. Spherical models based on distribution function components showed that the M / L is increasing outwards in these galaxies with however rather standard values in the inner parts (consistent with observed stellar populations). They also convincingly showed that the derived increase in M / L is consistent with the one inferred from X ray halo studies.
The first significant attempt at deriving stellar M / L in flattened early-type galaxies was achieved by van der Marel [27], who solved the Jeans equations to model a sample of elliptical and lenticular galaxies. A clear trend of M / L increasing with luminosity was obtained, although with a relatively large scatter. The advent of more general modelling techniques, such as the Schwarzschild method [28, 29, 30] and its application to high quality stellar kinematics [31, 32, 33] led to impressive progresses in our understanding of the dynamical structure of nearby galaxies [34, 35, 26]. One nagging issue was the recurrent appearance of the degeneracy between black hole mass and M / L, clearly illustrated in the first ambitious study of this kind by Gebhardt et al. [34], which thus require both high spatial resolution and large-scale spectroscopic data. The even greater need for two-dimensional spectroscopy to obtain realistic models of galaxies was subsequently emphasised [36, 37]. An apparent degeneracy of the models with respect to the often unknown inclination parameter was also suggested by Krajnovic et al. [37], the mass-to-light ratio not being significantly affected by this issue.
Following this path, Thomas et al. [26] obtained a rather strong constraint on the presence of dark matter at a few effective radii of the Coma galaxy NGC 4807 with an increase in M / L of more than an order of magnitude between 1 and 5 Re (Fig. 6). The stars are, however, still dominant within 1 Re as confirmed by Cappellari et al. [25] using state-of-the-art Schwarzschild models and integral-field data. This work also showed that the maximum contribution from non-homology of early-type galaxies to the tilt of the fundamental plane is about 6%, as the dynamical M / L (from dynamical models) and the M / L derived from the Virial theorem (as predicted using the stellar kinematic maps) agree amazingly well with each other (Fig. 5). This suggests that the tilt of the FP is dominated by a true variation of the M / L from galaxy to galaxy. A comparison of the dynamical M / L and the stellar M / L (obtained via stellar line indices) finally suggests that massive slowly rotating galaxies have a larger fraction of dark matter than fainter ones, with an upper limit of about 30% within 1 Re [25].
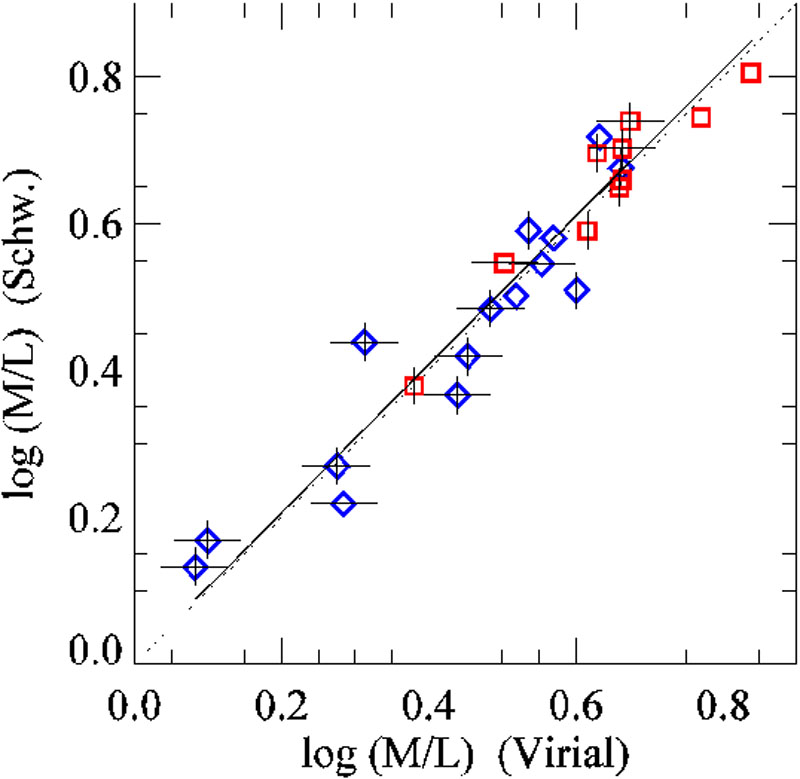 |
Figure 5. Dynamical M / L (as derived from Schwarzschild models) versus Virial M / L (derived from stellar kinematics) for a sample of 25 early-type galaxies obtained by Cappellari et al. [25]. Extracted from [25] (see paper for details). |
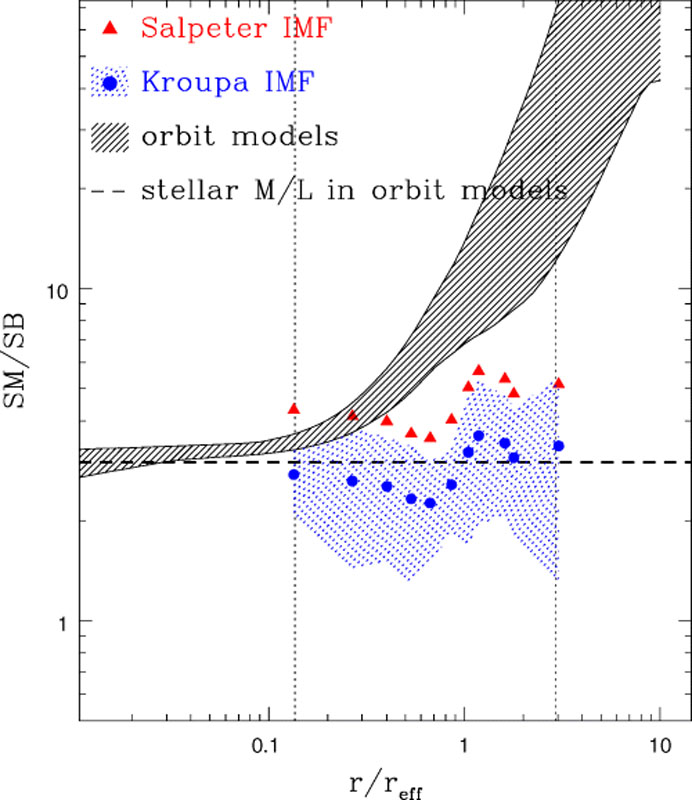 |
Figure 6. Surface mass versus brightness for the Coma galaxy NGC 4807 as predicted by the Schwarzschild model (grey area) and compared to the one expected from a Salpeter (red line) or Kroupa (blue line) IMF. Extracted from Thomas et al. [26] (see paper for details). |