


Before reviewing, in the next section, the latest observational advances achieved with Swift, the observational progress made up to that time is briefly surveyed. More extensive discussion and references on observations previous to 2004 are, e.g. in [127, 471, 525, 377].
The  -ray
phenomenology of GRB was extensively studied and
characterized by the BATSE instrument on the Compton GRO satellite
[127].
The -ray
spectra are non-thermal,
typically fitted in the MeV range by broken power-laws whose energy per
decade peak is in the range 50-500 KeV
[19],
sometimes extending to GeV energies
[205].
GRB appeared to leave no detectable
traces at other wavelengths, except in some cases briefly in X-rays.
The gamma-ray durations range from 10-3 s to about
103 s, with a
roughly bimodal distribution of long bursts of tb
-ray
phenomenology of GRB was extensively studied and
characterized by the BATSE instrument on the Compton GRO satellite
[127].
The -ray
spectra are non-thermal,
typically fitted in the MeV range by broken power-laws whose energy per
decade peak is in the range 50-500 KeV
[19],
sometimes extending to GeV energies
[205].
GRB appeared to leave no detectable
traces at other wavelengths, except in some cases briefly in X-rays.
The gamma-ray durations range from 10-3 s to about
103 s, with a
roughly bimodal distribution of long bursts of tb
 2 s and short
bursts of tb
2 s and short
bursts of tb
 2s
[237],
and substructure sometimes down
to milliseconds. The gamma-ray light curves range from smooth, fast-rise
and quasi-exponential decay (FREDs), through curves with several peaks,
to highly variable curves with many peaks
[127,
238]
(Figure 1). The pulse distribution is complex
[369],
and the time histories can provide clues for the geometry of the emitting
regions [121,
122].
2s
[237],
and substructure sometimes down
to milliseconds. The gamma-ray light curves range from smooth, fast-rise
and quasi-exponential decay (FREDs), through curves with several peaks,
to highly variable curves with many peaks
[127,
238]
(Figure 1). The pulse distribution is complex
[369],
and the time histories can provide clues for the geometry of the emitting
regions [121,
122].
 |
Figure 1. Diversity of gamma-ray light curves observed by BATSE [127] |
GRB were conclusively shown to be at cosmological distances following
Beppo-SAX localizations of their X-ray afterglows in 1997
[74],
followed by optical host galaxy identification and redshift determinations
[472].
The afterglows decay as a power law in time in a manner
predicted by pre-existing models
[305],
softening in time from
X-rays to optical to radio (e.g. Figure 2).
The energy needed to explain the total (mainly gamma-ray) energy fluence
can be as large as 1054( /
4
/
4 ) ergs, where
 is the
solid angle into which the gamma-rays are beamed.
This is for the highest fluences seen in some of the most distant bursts,
although for many bursts the energy budget problem is not as extreme. If
the emission is assumed to be emitted isotropic (isotropic equivalent
luminosity or energy) this energy ranges up to a solar rest mass in
gamma-rays. This would strain a stellar origin interpretation, since
from basic principles and experience
it is known that, even for the most efficient radiation conversion schemes,
a dominant fraction of the energy should escape in the form of thermal
neutrinos and gravitational waves. The energy requirements, however, are
much less severe in the case when the emission is collimated
(Section 2.2).
is the
solid angle into which the gamma-rays are beamed.
This is for the highest fluences seen in some of the most distant bursts,
although for many bursts the energy budget problem is not as extreme. If
the emission is assumed to be emitted isotropic (isotropic equivalent
luminosity or energy) this energy ranges up to a solar rest mass in
gamma-rays. This would strain a stellar origin interpretation, since
from basic principles and experience
it is known that, even for the most efficient radiation conversion schemes,
a dominant fraction of the energy should escape in the form of thermal
neutrinos and gravitational waves. The energy requirements, however, are
much less severe in the case when the emission is collimated
(Section 2.2).
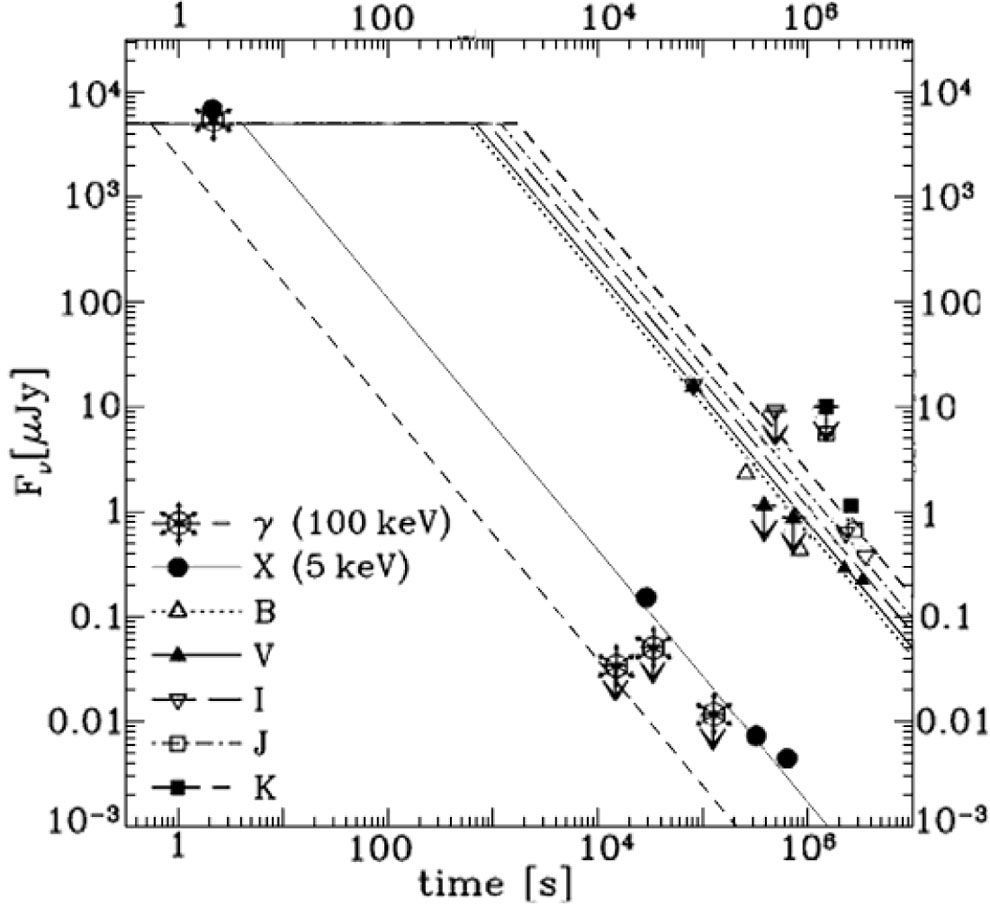 |
Figure 2. The afterglow light curves of GRB 970228 [515]. |
GRB afterglow light curves such as those shown in Figure 2 have been followed up starting several hours after the trigger in X-rays by Beppo-SAX and subsequently HETE-2, and in the optical/IR from ground-based telescopes (or in some case with HST), and have been explained in terms of forward shock emission (for discussions of the pre-Swift data interpretation see, e.g. [471, 298, 525, 377]). Afterglows have been followed up at radio wavelengths in some cases over months, and the analysis and interpretation of the radio spectra and light curves [470, 38, 136] provides important clues for the calorimetry and the multi-waveband model fits discussed in 5.1.
2.1. Progenitor candidates
There is now strong observational evidence [471] that GRB result from a small fraction (~ 10-6) of stars which undergo a catastrophic energy release event toward the end of their evolution. For the class of long GRB the candidates are massive stars whose core collapses [514, 346, 141] to a black hole, either directly or after a brief accretion episode, possibly in the course of merging with a companion. This scenario is referred to as the collapsar or hypernova scenario, which received strong support through the secure spectroscopic detection in some cases of an associated supernova event (e.g. [150, 455, 196]; see also Sections 2.4, 8.2). For short bursts the most widely speculated candidates are mergers of neutron star (NS) binaries or neutron star-black hole (BH) binaries [343, 167, 105, 299, 306, 258, 412, 413, 259], which lose orbital angular momentum by gravitational wave radiation and undergo a merger. This second progenitor scenario has only now begun to be tested thanks to the Swift detection of short burst afterglows (see Section 3, Section 7). Both of these progenitor types are expected to have as an end result the formation of a few solar mass black hole, surrounded by a temporary debris torus whose accretion can provide a sudden release of gravitational energy, sufficient to power a burst. An important point is that the overall energetics from these various progenitors need not differ by more than about one order of magnitude [309]. The duration of the burst in this model is related to the fall-back time of matter to form an accretion torus around the BH [141, 380] or the accretion time of the torus [332]. Other related scenarios include the formation from a stellar collapse of a fast-rotating ultra-high magnetic field neutron star [468, 465, 453, 508, 418].
2.2. Light curve breaks and jets
An important subsequent development was the observation, in many of the
well-sampled afterglows, of a break or steepening of the X-ray and optical
light curves [244,
135],
which can be interpreted as being due
to the outflow being jet-like and the break occurs when the edge of the jet
becomes visible, as the jet slows down
[408,
409,
442,
307].
The typical (long burst )inferred jet opening angles are
 j ~ 5-20
degrees, which reduces the total energy requirements from
1053 - 1054 erg to ~ 1051 ergs
[135,
352],
with a dispersion of a
factor ~ 10. The details are dependent on assumptions about the jet
geometry, and whether one addresses the gamma-ray energy
[135]
or the jet kinetic energy
[352],
with a somewhat larger dispersion in
the latter. Variable optical linear polarization is expected at the time of
a jet break
[435,
165,
415],
which can provide additional
constraints, also on the jet structure.
Light curve break determinations continued through the Beppo-SAX and HETE-2
afterglow observation periods, mainly in the optical. Break observations
in the Swift era are discussed in
Section 5.5.
j ~ 5-20
degrees, which reduces the total energy requirements from
1053 - 1054 erg to ~ 1051 ergs
[135,
352],
with a dispersion of a
factor ~ 10. The details are dependent on assumptions about the jet
geometry, and whether one addresses the gamma-ray energy
[135]
or the jet kinetic energy
[352],
with a somewhat larger dispersion in
the latter. Variable optical linear polarization is expected at the time of
a jet break
[435,
165,
415],
which can provide additional
constraints, also on the jet structure.
Light curve break determinations continued through the Beppo-SAX and HETE-2
afterglow observation periods, mainly in the optical. Break observations
in the Swift era are discussed in
Section 5.5.
Prompt optical flashes (starting within tens of seconds after the gamma-ray trigger) have been reported from ground-based small robotic telescopes in a few bursts [4, 10]. These arise much earlier, are initially brighter and decay more steeply than more ubiquitous long-term, slow decaying optical afterglows generally detected since 1997. They are also rare: between 1999 and 2004 there were only a handful of prompt optical flashes detected with robotic ground telescopes [10]. Since the Swift launch, more than twenty prompt UVOT (or ground-based robotic) optical flashes have been seen, mostly at times starting several hundreds of seconds after the trigger. None have been as bright as the first one detected in GRB 990123, except for the notable most distant GRB 050904, whose optical brightness is comparable to that of GRB 990123 [54]. This is discussed further in Section 6.5.
2.4. Association with supernovae
At least some long GRBs are associated with supernova explosions. The first reported example was the GRB980425 / SN1998bw association [150, 241, 473]. SN 1998bw was a peculiar, energetic Type Ib/c supernova. Using it as a template, other possible associations have been claimed through identifying a so-called red supernova bump on the optical afterglow light curves of GRB 980326 [49], GRB 970228 [401, 151], GRB 000911 [254], GRB 991208 [63], GRB 990712 [431], GRB 011121 [50], GRB 020405 [382] and GRB 031203 [70, 281]. The first unambiguous supernova signature (SN 2003dh) was detected in the z = 0.168 GRB 030329, firmly establishing the GRB-SN associations [455, 196]. Another GRB/SN event, GRB060218 / SN2006aj, is discussed in Section 3, and the supernova connection is discussed further in Section 8.2.
X-ray flashes (XRFs) are a class of bursts whose light curves and spectra resemble typical GRB, except for the fact that their spectra are much softer, their spectral peaks Epk being typically tens of keV or less [194, 223]. XRFs were first identified with the Beppo-SAX satellite, and have been studied in greater detail and numbers with the HETE-2 satellite [25, 250]. Their fluxes and isotropic equivalent luminosities tend to be smaller than for GRB, which makes afterglow searches more difficult. Nonetheless, several afterglows have been detected, and redshifts have been measured in some of them ([447], also Sections 3, 6).
2.6. Empirical correlations and distance estimators
The collimation-corrected total burst energy clustering around 1051 ergs, while making a stellar origin quite plausible, is unfortunately not sufficiently well defined to use as standard luminosity candles, whose apparent brightness would provide a distance determination. There are other possible distance measures, based on empirical correlations between burst observables. One of these is an apparent gamma-ray light curve variability correlation with the isotropic equivalent luminosity [120, 399]. Another is the time lag (between higher energy versus lower energy) gamma-rays and the isotropic luminosity [336, 20, 337]. Attempts at modeling the spectral lags have relied on observer-angle dependences of the Doppler boost [321, 432]. In these correlations the isotropic equivalent luminosity was used, in the absence of jet signatures, and they must be considered tentative for now. However, if confirmed, they could be invaluable for independently estimating GRB redshifts. A third one is a correlation between the spectral properties and the isotropic luminosity [7, 56, 15, 276]. These measures can be effectively calibrated only for light curves or spectra obtained with the same instrument and when redshifts are available. For the above methods the calibration set consists typically of a dozen bursts, which is insufficient for being considered reliable. The data set is now rapidly increasing with new Swift redshift determinations, but the Swift spectra are less well constrained at energies above 150 keV than with Beppo-SAX.
In recent years, attention has been drawn to a correlation between the
photon spectral peak energy Epk and the apparent
isotropic energy Eiso, or the isotropic luminosity
Liso
[8]
of the form Epk
 Eiso1/2. For GRB, this correlation
has been calibrated on a sample consisting of around ten bursts. While
strongly suggestive, the sample is relatively small and the dispersion
is large, so its usefulness as a distance measure is precarious.
Another suggestive result is that for some X-ray flashes whose redshift has
been measured the correlation continues to hold
[250],
even though the peak energy is ~ 1.5 and the Eiso is
~ 3 orders of magnitude lower than for GRB.
Eiso1/2. For GRB, this correlation
has been calibrated on a sample consisting of around ten bursts. While
strongly suggestive, the sample is relatively small and the dispersion
is large, so its usefulness as a distance measure is precarious.
Another suggestive result is that for some X-ray flashes whose redshift has
been measured the correlation continues to hold
[250],
even though the peak energy is ~ 1.5 and the Eiso is
~ 3 orders of magnitude lower than for GRB.
An interesting development of the Epk -
Eiso correlation is the
proposal of a relationship between the collimation-corrected total
energy (Ej and the photon spectral peak. Modeling the
jet break
under the assumption that the jet expands into a uniform density external
medium, this has the form Epk
Ej0.7 for a jet assumed to
propagate in a homogeneous medium
[159,
84,
160,
161],
and the relation appears to be tighter than the previously discussed
Epk
Eiso1/2 (Amati) relation.
This requires for calibration both an observed redshift and a light curve
break. If it holds up for a larger calibration sample than the current
(~ 18 bursts so far), it could be of promise as a cosmological tool
[251,
162].
There are however problems to resolve before this
becomes competitive with SNIa as a cosmological tool
[139].
The main ones are the presence of outliers
[325],
the lack of a
large low redshift sample for calibration (since using a high redshift
sample requires assumptions about the cosmology which it is supposed to
test), an evaluation of observational biases and
selection effects, and the dependence of the results on model assumptions
about the external medium and jet properties. The latter may be circumvented
by relying only on observables, e.g. Epeak, fluence
(or peak flux) and the break time tbr
[268,
330].
The dispersion, however,
remains so far about 1.5-2 times larger than for SNIa.