


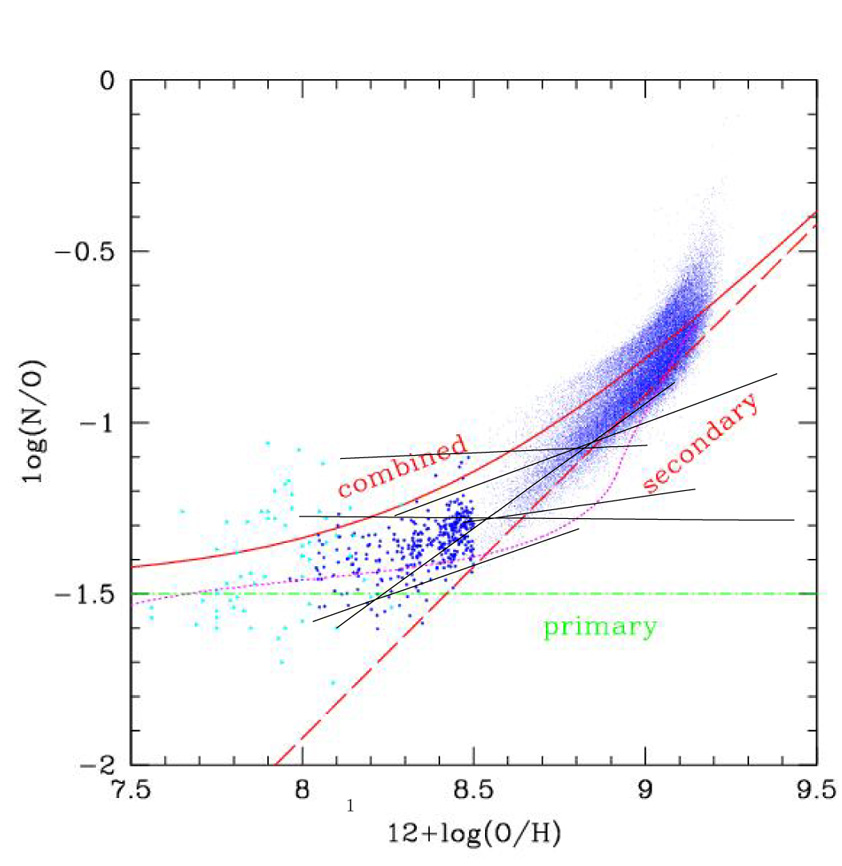
Nitrogen and oxygen are important tracers of the chemical evolution of galaxies. Not only are they among the most abundant elements; they are also measurable, from the emission lines of HII regions (and PNe in some cases), in galaxies up to rather large distances, where they are often the only available metallicity indicators. Oxygen is mainly produced by massive stars, whilst nitrogen is mostly synthesized by intermediate-mass stars. In the framework of the simple model of galaxy evolution [Tinsley (1980)] the enrichments of primary elements are independent of each other, whilst the growth of a secondary element goes as the square of the growth of a primary. The double nature (primary and secondary) of the N production became apparent when the N and O measured in HII regions of a number of spirals [Diaz & Tosi (1986)], including the Milky Way, and of late-type dwarf galaxies [Matteucci & Tosi (1985)] were compared with the predictions of adequate chemical evolution models: a significant fraction (between 30% and 60%) of N must be primary to explain the rather flat trend of N/O vs O/H inferred from HII regions in both late-type dwarfs and individual spirals. The straight lines in the left-hand panel of Fig. 3 show least-squares fits to the N/O vs oxygen abundances derived by [Diaz & Tosi (1986)] from the HII regions in the Galaxy, M31, M33, M101, NGC 2403 and IC342 (for more accurate and updated data see [Pilyugin, Thuan, & Vilchez (2003)]). The fits for these individual spirals are overplotted on a very recent version of the N/O vs O/H diagram including results from the Sloan Digital Sky Survey [Liang et al. 2006].
 |
 |
Figure 3. N/O vs O/H in different galaxies as derived from HII region observations (dots). The plot on the left-hand panel is from [Liang et al. 2006] and shows the SDSS data as dots. The thick straight lines show the trends in individual spirals from [Diaz & Tosi 1986]. The right-hand panels are blow-ups of the metal-poor region of the diagram and the lines show some of the effects of galaxy evolution (see text for details). |
|
The N/O vs O/H diagram is sometimes interpreted as an evolution plot. However, the oxygen abundance in abscissa cannot be taken as a proxy for time. In fact, each of the plotted dots corresponds to an HII region, whose abundance reflects the final (current) result of the whole history of chemical enrichment in the host galaxy region. Such history is known to be quite different for different types of galaxies, since it depends on SF history, gas accretion (infall) and loss (winds), interactions with companions, etc. As such, the position of each point in the plot depends on the different evolutions of different galaxies, and not only on the nature (primary or secondary) of the N nucleosynthesis (see also [Edmunds & Pagel 1978, Pilyugin, Thuan, & Vilchez 2003]).
Much attention has been payed to the metal-poor end of the N/O vs O/H
diagram, where late-type metal-poor dwarfs are located, to discuss
either the possibility of primary production of N in massive stars, or
the possible connection between late-type dwarfs and Damped
Lyman- systems. The plots on the right-hand
side of Fig. 3 show some of the effects on the N
and O abundances occurring during galaxy evolution. The lines shown in
the two diagrams on the right correspond to the predictions of different
chemical evolution models for the time behaviour of oxygen and nitrogen
in a late-type dwarf
galaxy. The top-right panel compares with the abundances measured from the
HII regions observed in late-type dwarfs (dots) the model predictions by
[Pilyugin 1993]
for a generic Blue Compact galaxy experiencing about ten SF bursts.
It shows how the HII region self-enrichment and the
different timescales for the stellar ejection and subsequent diffusion
in the ISM of oxygen and nitrogen lead to a saw-tooth shape for the N/O
ratio as a function of oxygen.
systems. The plots on the right-hand
side of Fig. 3 show some of the effects on the N
and O abundances occurring during galaxy evolution. The lines shown in
the two diagrams on the right correspond to the predictions of different
chemical evolution models for the time behaviour of oxygen and nitrogen
in a late-type dwarf
galaxy. The top-right panel compares with the abundances measured from the
HII regions observed in late-type dwarfs (dots) the model predictions by
[Pilyugin 1993]
for a generic Blue Compact galaxy experiencing about ten SF bursts.
It shows how the HII region self-enrichment and the
different timescales for the stellar ejection and subsequent diffusion
in the ISM of oxygen and nitrogen lead to a saw-tooth shape for the N/O
ratio as a function of oxygen.
The bottom-right panel show instead the predictions by RTM06 for the starburst dwarf NGC 1569 (always the line with higher N/O for each line-type; blue in the colour version of the figure) and the Blue Compact dwarf NGC 1705 (always the line with lower N/O for each line-type; red in the colour version of the figure). The big symbols with error bar indicate the corresponding values derived from HII regions in NGC 1569 (blue square) and NGC 1705 (red diamond). The other points correspond to HII regions values in other late-type dwarfs. Different line-types correspond to different assumptions on the stellar yields or on the galactic wind efficiency. See RTM06 for references and details. All the lines show model predictions for the evolution of oxygen and nitrogen with time and it is apparent how much the time behaviour can be different from a simple fit to the current N/O vs O/H distribution inferred from HII regions.
In spite of the different classification, NGC 1569 and NGC 1705 have quite similar properties (see e.g. [Annibali et al. 2003, Angeretti et al. 2005] and references therein): similar gas and star masses, metallicity, IMF, SF history with very strong recent activity, and observational evidence of similarly strong galactic winds. Yet, they have quite different N/O ratios, which require different evolutionary assumptions. The long-dashed lines in the bottom-right panel of Fig. 3 show the model predictions based on the standard yields by [van den Hoek & Groenewegen 1997] for intermediate mass stars. Clearly a standard N production may be consistent with the N/O ratio observed in NGC 1569, but un-reconcilable with the low N/O of NGC 1705. If we consider yields with smaller N production, even in the extreme case of those by [Meynet & Maeder 2002] where the hot-bottom burning phase has not been computed, the models overpredict the N/O ratio observed in NGC 1705 (short-dashed lines). A better fit to the observed abundances is obtained (RTM06) if not only the nitrogen production in intermediate mass stars is relatively low, as predicted for instance by the minimal hot-bottom burning case proposed by [van den Hoek & Groenewegen 1997], but also a higher efficiency of nitrogen loss in the galactic wind is allowed in NGC 1705 than in NGC 1569 (solid lines).
Detailed chemical evolution models of individual dwarfs, such as those shown here for NGC 1569 and NGC 1705, have become possible only recently, mostly thanks to HST, which has allowed to derive their SF histories back to quite early epochs. Two kinds of models for individual galaxies can be computed: standard chemical evolution models (e.g. [Carigi, Colin, & Peimbert 1999, Lanfranchi & Matteucci 2003, Romano, Tosi, & Matteucci 2006]) and chemo-dynamical models (e.g. [Recchi et al. 2002, Recchi et al. 2006]). The former have the drawback of a simplistic treatment of star and SN feedbacks and gas motions, the latter have the problem that the timescales appropriate for hydrodynamics make it prohibitive, in terms of CPU time, to follow the system evolution over more than 1 Gyr. The challenge in the next few years is to improve both types of approaches and get a more realistic insight of how stars and gas evolve, chemically and dynamically, in their host galaxies.