


Extinction is a combined effect of absorption and scattering.
Since a grain absorbs and scatters light most effectively
at wavelengths comparable to its size

 2
2 a,
the wavelength dependence of extinction
("extinction curve") constrains the dust size distribution.
a,
the wavelength dependence of extinction
("extinction curve") constrains the dust size distribution.
2.1. Interstellar Extinction: Milky Way, SMC, and LMC
Interstellar extinction is most commonly
obtained through the "pair-method" by comparing
the spectra of two stars of the same spectral type,
one of which is reddened and the other unreddened.
Interstellar extinction curves rise from the near-IR to the near-UV,
with a broad absorption feature at about
-1
4.6
µm-1
(
2175 Å),
followed by a steep rise into the far-UV
-1
10
µm-1 (see Fig. 1).
This wavelength dependence indicates that
there must exist in the ISM a population of large grains with a
 /
2
0.1 µm
to account for the extinction at visible/near-IR wavelengths,
and a population of ultrasmall grains
with a
/
2
0.1 µm
to account for the extinction at visible/near-IR wavelengths,
and a population of ultrasmall grains
with a  /
2
0.016 µm
to account for the far-UV extinction at
= 0.1
µm. In the wavelength range of 0.125
/
2
0.016 µm
to account for the far-UV extinction at
= 0.1
µm. In the wavelength range of 0.125
 3.5 µm,
the Galactic extinction curves can be approximated by an analytical
formula involving only one free parameter: RV
3.5 µm,
the Galactic extinction curves can be approximated by an analytical
formula involving only one free parameter: RV
 AV /
E(B - V), the total-to-selective extinction ratio
(Cardelli et al. 1989),
with RV
3.1
for the Galactic average (see Fig. 1).
The optical/UV extinction curves and RV show
considerable regional variations and
depend on the environment: lower-density regions have
a smaller RV, a stronger 2175 Å bump
and a steeper far-UV rise
(-1
> 4 µm-1), implying smaller dust in these
regions; denser regions have a larger RV,
a weaker 2175 Å bump and a flatter far-UV rise, implying larger dust.
AV /
E(B - V), the total-to-selective extinction ratio
(Cardelli et al. 1989),
with RV
3.1
for the Galactic average (see Fig. 1).
The optical/UV extinction curves and RV show
considerable regional variations and
depend on the environment: lower-density regions have
a smaller RV, a stronger 2175 Å bump
and a steeper far-UV rise
(-1
> 4 µm-1), implying smaller dust in these
regions; denser regions have a larger RV,
a weaker 2175 Å bump and a flatter far-UV rise, implying larger dust.
 |
Figure 1. Interstellar extinction curves of the Milky Way (RV = 2.75, 3.1, 4.0, 5.5). There exist considerable regional variations in the Galactic optical/UV extinction curves, as characterized by the total-to-selective extinction ratio RV, indicating that dust grains on different sightlines have different size distributions. |
In the Small Magellanic Cloud (SMC), the extinction curves
of most sightlines display a nearly linear steep rise with
-1
and an extremely weak or absent 2175 Å bump
(Lequeux et al. 1982;
Prévot et al. 1984;
see Fig. 2),
suggesting that the dust in the SMC is smaller than
that in the Galactic diffuse ISM as a result of either
more efficient dust destruction in the SMC
due to its harsh environment of the copious star formation
associated with the SMC Bar or lack of growth due to
the low-metallicity of the SMC, or both.
The Large Magellanic Cloud (LMC) extinction curve
is characterized by a weaker 2175 Å bump and a stronger far-UV rise
than the Galactic curve
(Nandy et al. 1981;
Koornneef & Code 1981),
intermediate between that of the SMC
and that of the Galaxy (see Fig. 2).
Regional variations also exist in the SMC and LMC extinction curves.
 |
Figure 2. Interstellar extinction curves of the Milky Way (RV = 3.1, 4.4), SMC, and LMC. Also plotted is the "Maiolino"-type extinction curve for AGNs (similar to the Galactic RV = 4.4 curve) produced by a mixture of interstellar silicate and graphite grains with a size distribution of dn / da ~ a-3.5 (50 Å < a < 10 µm), the same as that for the Galactic average RV = 3.1 except with a smaller upper cutoff for the latter (50 Å < a < 0.25 µm). |
2.2. AGN Extinction - "Gray" or SMC-like Extinction?
Little is known about the wavelength dependence of the extinction caused by the circumnuclear dust of AGNs. In literature, the AGN extinction curves are mainly inferred from (1) composite quasar spectra, and (2) individual reddened AGNs. The former often reveals a "gray" extinction, implying that the size distribution of the dust in the AGN circumnuclear environments is skewed towards substantially large grains. The latter often suggests a steep-rising SMC-like extinction, indicating a preponderance of small grains near the nucleus. There is also indirect information, including the dust reddening- and extinction-to-gas ratios and the IR emission modeling of AGNs (see Section 4).
Composite Reddened Quasar Spectra - "Gray" Extinction? Czerny et al. (2004) constructed a quasar extinction curve based on the blue and red composite quasar spectra of Richards et al. (2003) obtained from the Sloan Digital Sky Survey (SDSS). Six composite quasar spectra were generated by Richards et al. (2003) from 4576 SDSS quasars based on the relative g*-i* color with "Composite 1" (made from 770 objects) being the bluest. Czerny et al. (2004) created a mean "quasar extinction curve" by averaging 3 extinction curves obtained through comparing the spectra of Composites 3, 4, and 5 (consisting of 770, 770, and 211 objects, respectively) with that of Composite 1, assuming that Composite 1 is essentially unaffected by dust while Composites 3, 4, and 5 are subject to dust reddening. The resulting extinction curve is nearly monotonic with wavelength, without any trace of the 2175 Å bump (see Fig. 3).
Gaskell et al. (2004) derived extinction curves for radio-loud quasars based on the composite spectra of 72 radio quasars created by Baker & Hunstead (1995), and for radio-quiet AGNs based on the composite spectrum of 1018 radio-quiet AGNs generated by Francis et al. (1991). The extinction curve for these radio-loud quasars, grouped by Baker & Hunstead (1995) into 4 subsamples according to the 5 GHz radio core-to-lobe flux ratios R, was determined by comparing the composite spectrum of the more-reddened lobe-dominant (R < 0.1) sample with that of less-reddened core-dominant (R > 1) sample. Similarly, Gaskell et al. (2004) obtained an extinction curve for radio-quiet AGNs by comparing the composite spectrum of Francis et al. (1991) created for 1018 radio-quiet AGNs with that for the relatively unreddened core-dominant composite of Baker & Hunstead (1995). Most prominently, the derived extinction curves for both radio-loud quasars and radio-quiet quasarssy lack the 2175 Å bump and are essentially "gray", i.e., significantly flatter in the UV than that of the Milky Way diffuse ISM, although it appears that for the latter the reddening curve is slightly steeper in the UV (see Fig. 3).
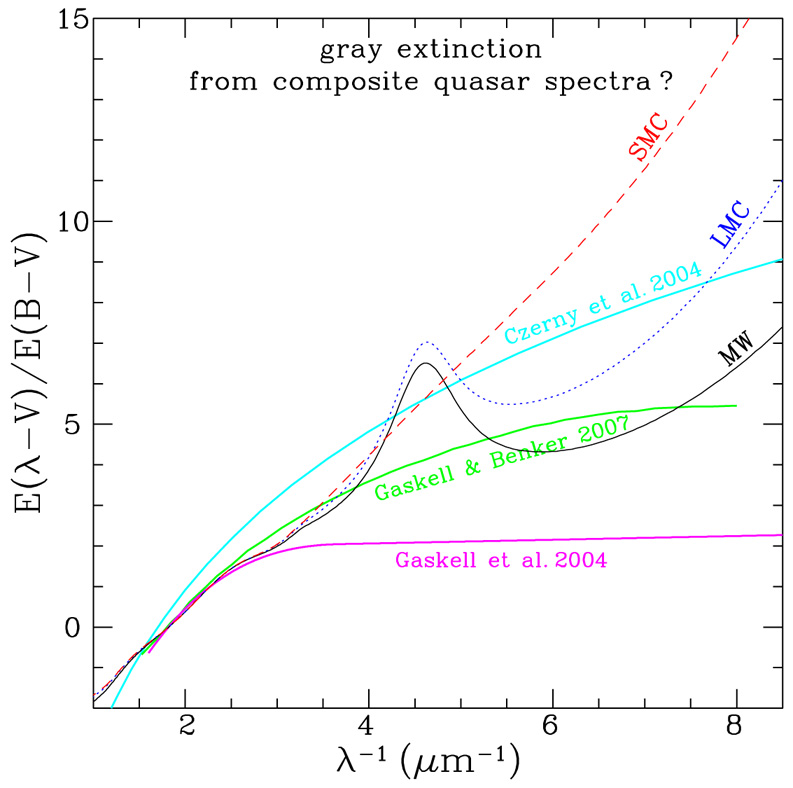 |
Figure 3. Comparison of the AGN extinction curves derived from composite quasar spectra (Czerny et al. 2004, Gaskell et al. 2004) with that for the Milky Way, SMC, and LMC. For comparison, also shown is the average extinction curve obtained for individual AGNs by Gaskell & Benker (2007). |
However, Willott (2005) questioned the validity of the approach based on the ratios of reddened and unreddened composite quasars (Czerny et al. 2004; Gaskell et al. 2004) since composite spectra combine quasars at different redshifts, while the quasars going into a composite spectrum have a negative correlation between reddening and redshift, and quasar surveys in practice contain more highly reddened quasars at lower redshifts. He argued that since the quasars contributing to the composite in the UV have typically lower reddening than those contributing in the optical, the gray UV extinction laws derived using composite quasars (Czerny et al. 2004; Gaskell et al. 2004) might be artificial, and the actual AGN extinction curve may be SMC-like.
Individual Reddened AGNs - SMC-like Extinction? In contrast to the "composite quasar spectrum" method which may be biased by the fact that the highest redshift quasars (which contribute to the UV part of a composite spectrum) are less extincted (leading to shallower extinction in the UV), AGN extinction curves have also been derived for individual reddened objects.
Crenshaw et al. (2001) determined a reddening curve for the nucleus of the Seyfert 1 galaxy NGC 3227 by comparing its HST/STIS UV and optical spectra with that of the unreddened Seyfert galaxy NGC 4151. They found that the derived extinction curve in the UV is even steeper than that of the SMC and lacks the 2175 Å bump. Similar studies were performed for Ark 564, a Narrow-Line Seyfert 1 galaxy (Crenshaw et al. 2002). By comparing the HST/STIS UV and optical spectra of Ark 564 with that of Mrk 493, an unreddened Narrow-Line Seyfert 1 galaxy, Crenshaw et al. (2002) found that the extinction curve for Ark 564, with no evidence for the 2175 Å bump, rises to the UV more steeply than the Galactic extinction curve (but not as steeply as the SMC curve) with a longer turning-up wavelength of ~ 4000 Å (compared to ~ 2500 Å for the standard Galactic, LMC, and SMC curves).
In an analysis of the optical/UV color distribution of 4576 SDSS quasars, Richards et al. (2003) showed that 273 (6.0%) of the quasars in their sample appear to be redder because of SMC-like dust extinction and reddening. Hopkins et al. (2004) investigated the reddening law toward 9566 SDSS quasars, including a subset of 1886 quasars matched to 2MASS (Two Micron All Sky Survey) by exploring the shapes of their spectral energy distributions obtained from broadband photometry (at five SDSS bands ugriz and three 2MASS bands JHK). They found that the reddening toward quasars is dominated by SMC-like dust at the quasar redshift.
More recently, Gaskell & Benker (2007) determined the extinction curves for 14 individual AGNs based on the FUSE and HST spectrophotometry of Shang et al. (2005). Unlike Crenshaw et al. (2001, 2002) who used a single unreddened AGN as a reference, Gaskell & Benker (2007) took the average of 3 AGNs which have the highest 4-8 µm-1 fluxes relative to their optical fluxes in the sample of Shang et al. (2005). They found that the majority of the derived extinction curves in the UV are much flatter than that of the SMC, although not as flat as the "gray" curve derived by Gaskell et al. (2004) based on composite quasar spectra (see Fig. 3 for the average extinction curve for the 5 AGNs with the greatest reddening in their sample).
Reduced Reddening- and Extinction-to-Gas Ratios
- Flat Extinction?
Assuming a Galactic standard extinction curve (RV = 3.1)
and a foreground screen,
Maiolino et al. (2001a)
determined for 19 AGNs the amount of reddening E(B -
V) affecting the broad line region by comparing the observed
optical/IR H broad line ratios with the intrinsic values.
For these AGNs, they also determined
the X-ray absorbing column densities NH from
the photoelectric cutoff in their X-ray spectra.
They found that for most (16 of 19) objects
E(B - V) / NH is significantly
lower than the Galactic standard value
( 1.7 ×
10-22 mag cm-2) by a factor ranging from a few to
~ 100 (except for 3 Low Luminosity AGNs whose physics may
be intrinsically different [see
Ho 1999]).
Similarly,
Maiolino et al. (2001a)
also found that the extinction-to-gas ratios AV /
NH of various classes of AGNs are significantly lower
than the Galactic standard value
( 5.3 ×
10-22 mag cm-2).
Maiolino et al. (2001b)
ascribed the reduced
E(B - V) / NH and
AV / NH ratios of AGNs
(often with a solar or higher metallicity) to grain growth through
coagulation in the dense circumnuclear region which
results in a dust size distribution biased in favour
of large grains and therefore a flat extinction curve.
However, Weingartner & Murray (2002) argued that the X-ray absorption and optical extinction may occur in distinct media (e.g. the X-ray absorption occurs in material located off the torus and/or accretion disk, while the optical extinction occurs in material located beyond the torus); therefore, the reduced E(B - V) / NH and AV / NH ratios may not necessarily imply that the grains in AGNs are systematically larger than those in the Galactic ISM.