


Captain Boyle: "I ofen looked up at the sky an' assed meself the
question - what is the stars, what is the stars?"
Joxer Daly: "Ah, that's the question, that's the question - what is the
stars?"
Act 1 "Juno and the Paycock", Seán O'Casey, Irish playright (1924)
During the last fifteen years there has been mounting evidence that stars are a major constituent of HzRGs. Stellar signatures include (i) a plateau in the spectral energy distribution (SED) between 1 and 2 µm characteristic of stars - the "1.6 µm bump" (Simpson and Eisenhardt 1999, Seymour et al. 2007) (Fig. 1), (ii) the detection of rest-frame UV stellar absorption lines in a few HzRGs (Dey et al. 1997) and (iii) measurement with the HST that the morphologies of several HzRGs follow de Vaucouleurs profiles. (e.g. van Breugel et al. 1998, Pentericci et al. 2001, Zirm et al. 2005).
In principle, spectral energy distributions (SEDs) are a powerful diagnostic of stellar populations and galaxy evolution. Young (< 0.5 Gyr) stars dominate the SED in the UV, whereas the SED longward of 4000Å gives information about populations older than ~ 1 Gyr. However, disentangling the stellar contribution to the SEDs from the nonstellar components is complicated (see Fig. 1). At rest-frame UV wavelengths, contributions from scattered quasar light and nebular continuum must be taken into account, whereas re-radiation by dust contributes to the SED at far infrared and millimeter wavebands (e.g Fig. 1).
 |
Figure 11. The IR SED of 4C 40.36 at z = 2.265, with modeling, using data taken with IRAC and MIPS on the Spitzer Telescope. [From Seymour et al. (2007)]. The solid dark line indicates the total best-fit SED. The stellar and dust components are indicated by dashed and dotted lines, respectively. Note the plateau, corresponding to the stellar "~ 1.6 µm bump" feature (Simpson and Eisenhardt 1999). |
4.1. Old stars: HzRGs as the most massive galaxies
The SEDs of old (> 1 Gyr) stellar populations peak in the
near-IR. The galaxies with the largest K-band luminosities in the early
Universe are HzRGs. Because old stars are the best tracers of stellar
mass, the brightness of the observed K-band emission has long
been used to argue that distant radio galaxies are very massive, with
masses of up to 1012
M (Rocca-Volmerange et
al. 2004).
This places them on the upper end of the stellar mass function over the
entire redshift range 0< z < 4 (e.g.
Rocca-Volmerange et
al. 2004).
(Rocca-Volmerange et
al. 2004).
This places them on the upper end of the stellar mass function over the
entire redshift range 0< z < 4 (e.g.
Rocca-Volmerange et
al. 2004).
A major tool in HzRG research is the Hubble K-z diagram, introduced by Lilly and Longair (1984). Despite significant spectral correction effects (K-corrections), radio galaxies form a remarkably narrow sequence out to to z ~ 3, especially when compared with near-IR selected field galaxies (e.g. De Breuck et al. 2002) (Fig. 12). The small scatter in the K-z relation for HzRGs was found to be weakly correlated with radio luminosity (e.g. Best et al. 1998). Such a correlation can be understood if the radio power is dominated by the Eddington limiting luminosity of the nuclear supermassive black hole (Rawlings and Saunders 1991) (Section 5.2) and thus a measure of the black hole mass. The well-established relation between black hole and bulge mass (e.g. Magorrian et al. 1998) then implies that radio power would be correlated with host galaxy mass, as appears to be the case for low-redshift less-luminous radio galaxies (Best et al. 2005).
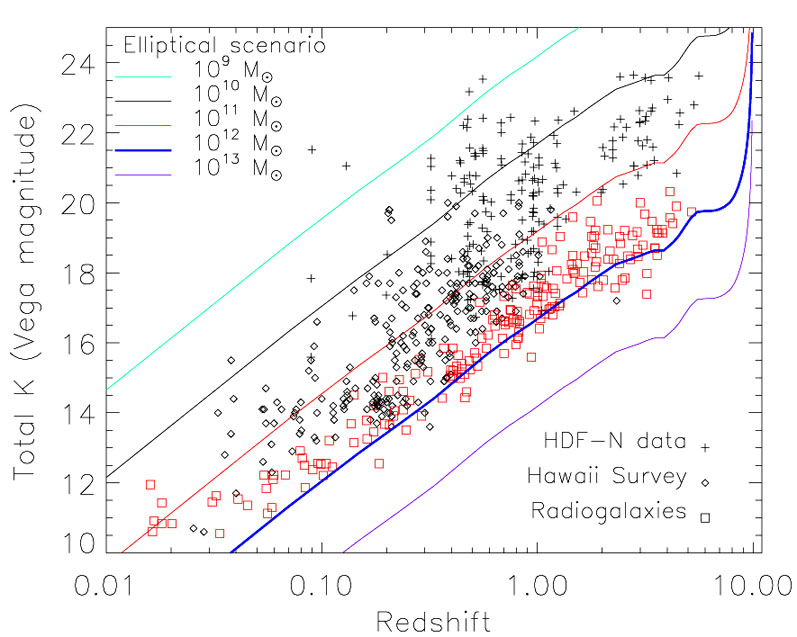 |
Figure 12. Composite Hubble K-z diagram of radio and optically selected galaxies, slightly modified from Rocca-Volmerange et al. (2004) and kindly provided to us by Brigitte Rocca. The radio galaxies are denoted by the red squares. The optically-selected galaxies are plotted in black (HDFN = crosses and Hawaii survey = dots). The radio galaxies trace the upper envelope of the K - z diagram, with HzRGs being amongst the brightest galaxies in the early Universe. Note that continuum fluxes derived from K-band or H-band magnitudes can be contaminated by bright emission lines in the band. Also plotted are K-magnitude tracks for elliptical galaxies formed from various initial reservoir gas masses (baryonic). These were calculated using the Pégase galaxy evolution models as described in Rocca-Volmerange et al. (2004). |
Caution should be exercised in determining the K-band continuum magnitudes for HzRGs and in interpreting the details of the K-z diagram in terms of galaxy masses. There are several reasons for this. First, it is often difficult to disentangle the stellar component from the warm dust component of the K-band flux. Secondly, depending on the redshift, there is also a contribution to the K-band emission from bright emission lines. Mass and age estimates derived from the uncorrected colors are therefore often overestimated (Eales and Rawlings 1996, Rocca-Volmerange et al. 2004). Thirdly, the stellar population models on which the masses are based are subject to considerable uncertainty. For example, incorporation of recent data on thermally pulsating asymptotic giant branch stars reduce the derived masses by large factors (Bruzual 2007). In addition the Initial Mass Function and the gas to dust content at early epochs is highly uncertain.
 |
Figure 13. Rest-frame H-band stellar luminosity vs. redshift for a sample of radio galaxies observed with the Spitzer Telescope. [From Seymour et al. (2007)]. The masses of stars are derived from the best-fit models to the multiband photometry, including Spitzer fluxes. Solid circles indicate HzRGs detected at 24 - 160 µm with MPIS. Open circles are luminosities derived from HzRGs that were not detected by MIPS. Upper limits are indicated by arrows. Dashed lines correspond to elliptical galaxies formed at zform = 10. Crosses mark the stellar luminosity of submillimeter galaxies. |
Because of its ability to measure the rest-frame near-IR fluxes of HzRGs
radio galaxies, the Spitzer Telescope, has facilitated considerable
progress in this field during the last few years.
Seymour et al. (2007)
surveyed 69 radio galaxies having 1 < z < 5.2 at 3.6, 4.5, 5.8,
8.0, 16 and 24 µm. They decomposed the rest-frame optical to
infrared spectral energy distributions into stellar, AGN, and dust
components and determined the contribution of host galaxy stellar
emission at rest-frame H band. By consistently deriving the stellar
luminosity at the same rest-frame wavelength near the peak of the
stellar emission at
 rest ~ 1.6
µm,
effects of measuring the K-z diagram with galaxies over a
large range of redshift through fixed observing bands were eliminated
and contamination of the fluxes by AGN and emission lines was
minimised.
rest ~ 1.6
µm,
effects of measuring the K-z diagram with galaxies over a
large range of redshift through fixed observing bands were eliminated
and contamination of the fluxes by AGN and emission lines was
minimised.
The Spitzer results confirm that radio galaxies have stellar masses
mostly within the 1011 to 1012
M range, with
almost no dependence on redshift. The fraction of emitted light at
rest-frame H band from stars was found to be > 0.6 for ~ 75% of the
HzRGs. The weak correlation of stellar mass with radio power determined
using ground-based data is only marginally significant in the Spitzer
results. Rest-frame near-IR studies of less luminous radio sources are
needed to extend the range in radio luminosity and settle whether there
is indeed a dependence of stellar mass on radio luminosity.
4.2. Young stars - UV absorption lines
HzRGs undergo vigorous star formation. The most direct evidence for this
is the detection of rest-frame UV photospheric stellar absorption lines
and P-Cygni features driven by stellar winds. Because observation of
these lines requires several hour exposures on 10m-class telescopes,
their detection is limited to the S V
1502 line in 4C 41.17
(Dey et al. 1997),
tentative measurement of C III
1428 in TN J2007-1316
(De Breuck and Reuland
2005)
and VLT spectroscopy of the Spiderweb Galaxy
(Miley et al. 2006,
Nesvadba et al. 2006,
Hatch et al. 2007).
The presence of absorption lines are direct evidence for prodigious star
formation in 4C 41.17 (up to 1500
M
yr-1, after correction for extinction)
(Dey et al. 1997,
Reuland et al. 2004).
For radio galaxies whose rest-frame UV continuum is polarised, scattered
AGN continuum emission
(Vernet et al. 2001),
make it difficult to measure the star formation rates directly.
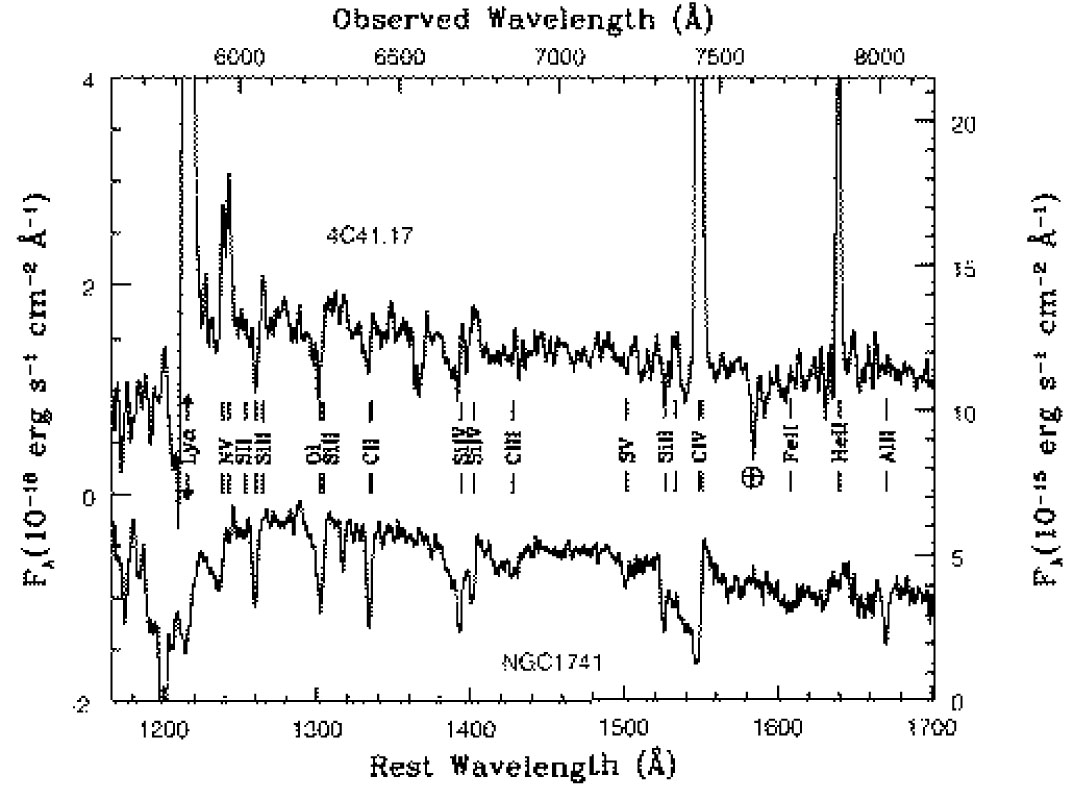 |
Figure 14. Spectrum of the central 2 × 1 of the HzRG 4C 41.17 at z = 3.8. [From Dey et al. (1997)]. This is compared with the UV spectrum of the B1 star-forming knot in the nearby Wolf-Rayet starburst galaxy NGC 1741 (Conti et al. 1996). The ordinate is labeled with the flux density scales for 4C 41.17 and NGC 1741B1 on the left and right axes respectively. The two spectra show many similarities in their absorption line properties. |
Additional evidence that substantial star formation is occurring in
HzRGs is provided by the sub-millimeter observations of dust, for whose
heating star formation rates of thousands
M per year are
needed (but see Section 3.5) and the
systematically larger Ly luminosities and Ly /
HeII ratios for HzRGs with z > 3, than for those with 2 < z < 3
(Villar-Martín et
al. 2007),
(Section 3.2.2).
luminosities and Ly /
HeII ratios for HzRGs with z > 3, than for those with 2 < z < 3
(Villar-Martín et
al. 2007),
(Section 3.2.2).
4.3. The alignment effect - Jet-induced star formation
One of the most remarkable properties of HzRG is the approximate
alignment between their radio and optical continuum emissions. This
phenomenon was completely unexpected when it was discovered two decades
ago
(Chambers et al. 1987,
McCarthy et al. 1987).
The "alignment effect" sets in for redshifts z
 0.7. Several models have
been proposed or considered to account for this alignments (e.g.
McCarthy 1993).
The two most promising models are (i) dust scattering of light from a
hidden quasar at the nucleus of the HzRG
(Tadhunter et al. 1998)
and (ii) triggering of star formation by the synchrotron jet
as it propagates outward from the nucleus
(De Young 1989,
Rees 1989,
Begelman and Cioffi
1989,
Bicknell et al. 2000).
We have already seen that radio jets frequently interact vigorously with
the warm gas in HzRGs.
0.7. Several models have
been proposed or considered to account for this alignments (e.g.
McCarthy 1993).
The two most promising models are (i) dust scattering of light from a
hidden quasar at the nucleus of the HzRG
(Tadhunter et al. 1998)
and (ii) triggering of star formation by the synchrotron jet
as it propagates outward from the nucleus
(De Young 1989,
Rees 1989,
Begelman and Cioffi
1989,
Bicknell et al. 2000).
We have already seen that radio jets frequently interact vigorously with
the warm gas in HzRGs.
Since the extensive review by McCarthy (1993), high resolution imaging with the HST has provided important new information on the morphologies of HzRGs and on the alignment effect. (Pentericci et al. 1999, Bicknell et al. 2000, Pentericci et al. 2001). Images with the HST have revealed that HzRG hosts generally have clumpy optical morphologies (Pentericci et al. 1998, 1999).
Using HST observations of a sample of 20 HzRGs combined with similar resolution VLA radio maps, Pentericci et al. (1999, 2001) have for the first time examined the close relationship between the radio and rest-frame UV and optical morphologies. They find that the alignment effect extends into the rest-frame optical, with the z > 2.5 radio galaxies displaying a much more clumpy structure than their low-redshift counterparts, which are well represented by de Vaucouleurs profiles. At a slightly lower resolution, near-IR imaging with the Keck Telescope (van Breugel et al. 1998) also suggest that the morphology changes from aligned clumpy structures at z>3 to relaxed de Vaucouleurs profiles at z < 3. However, the redshift-dependance of luminosity and the change in the observing wavelength with redshift complicates the interpretation of these results. We note that the IR structures of B2/6C galaxies at z ~ 1 appear less aligned with their radio structures than are the brighter 3C galaxies at this redshift, implying that the strength of the alignment effect depends on radio luminosity (Eales et al. 1997).
It is now clear that no single mechanism can completely account for all the observed properties of the aligned emission. The occurrence of optical polarisation in HzRGs in some but not all HzRGs is evidence that dust scattering plays a role. However, scattering cannot explain the observed detailed optical morphologies and similar bending behaviour that has been observed between the optical and radio structures. Neither can dust scattering account for the alignment of the continuum emission redwards of the rest frame 4000 A break. The alignment effect is most likely due to a combination of star formation induced by the jet and scattering of hidden quasar light along the radio source.
The most comprehensive study of jet-induced star formation has been made for of 4C 41.17 at z = 3.8 by Bicknell et al. (2000). The interaction of a high-powered (~ 1046 erg s-1) jet with a dense cloud in the halo of 4C 41.17 is shown to produce shock-excited emission lines and induce star formation. Such shock-initiated star formation could proceed on a timescale of a few × 106 yr), i.e well within the estimated lifetime of the radio source (few × 107 yr).
Studies of several low-redshift radio galaxies provide further evidence that jet-induced star formation occurs. These include NGC 541/Minkowski's Object (3C 40) (van Breugel et al. 1985, Croft et al. 2006), 3C 285 (van Breugel and Dey 1993) and the closest radio galaxy Centaurus A (Graham 1998). Such effects can be expected to be much more prevalent during the era of the Universe at z > 2, when every galaxy may well have undergone nuclear activity.
If the red aligned emission is indeed produced by stars, their ages would be > 1 Gyr, implying that this mode of star formation has operated almost since the formation of the host galaxies. It would also require that the radio jet was active and aligned in approximately the same position angle for this length of time. van Breugel et al. (1998) suggested that the tendency of HzRGs to be clumpier at z > 3 is due to the increased importance of jet-induced star formation at earlier epochs. We know little about how the first population of stars in galaxies were made. Although unconventional, it is tempting to speculate that jet-induced star formation played a significant role in producing stars during the first 3 Gyr after the Big Bang. Gopal-Krishna et al. (2004) have suggested that a large fraction of all proto-galactic material within the cosmic web was impacted by the expanding lobes of radio galaxies during the quasar era, triggering star formation.
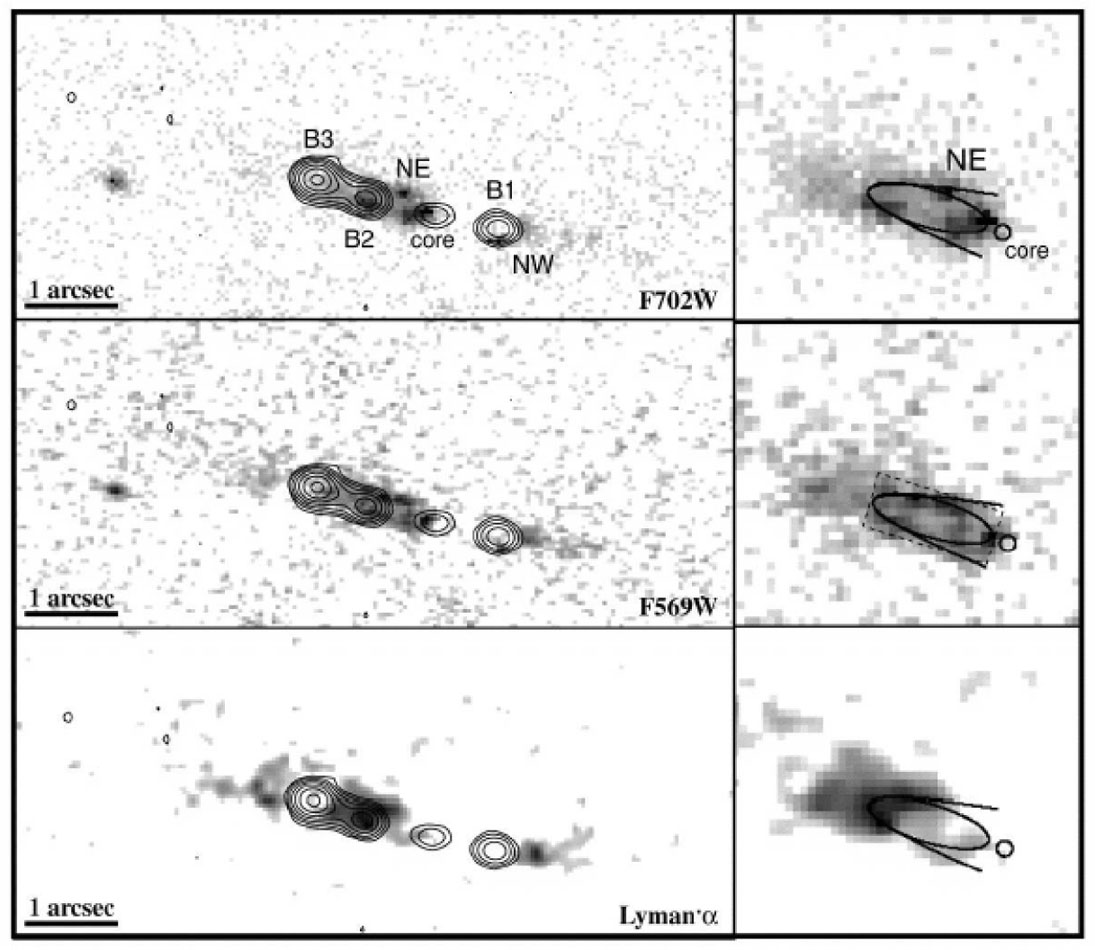 |
Figure 15. Evidence for jet-induced star
formation in 4C 41.17 at z = 3.8 [ From
Bicknell et
al. (2000)].
Montage of three HST images taken through the F702W, F569W (continuum),
and Ly |