


Clusters of galaxies are unique laboratories for the study of the nucleosynthesis and chemical enrichment of the Universe. Their deep gravitational potential wells keep all the metals produced by the stellar populations of the member galaxies within the cluster. The dominant fraction of these metals reside within the hot ICM. The chemical abundances measured in the intra-cluster plasma thus provide us with a "fossil" record of the integral yield of all the different stars (releasing metals in supernova explosions and winds) that have left their specific abundance patterns in the gas prior and during cluster evolution.
X-ray spectroscopy provides an accurate measure of metal abundances in the ICM. These abundances put constrains on nucleosynthesis and on the star formation history of the clusters, and as long as the stellar populations where the cluster metals were synthesized are representative, these measurements allow us to put constraints on the chemical evolution of the Universe as a whole.
The CCD type detectors on Chandra, XMM-Newton, and Suzaku allow us to detect the emission lines of O, Ne, Mg, Si, S, Ar, Ca, Fe, and Ni (see the left panel of Fig. 31). The 2p-1s Ne lines at 1.02 keV are in the middle of the Fe-L complex (lying between 0.8 to 1.4 keV). The energy resolution of the CCD type detectors is not sufficient to resolve the individual lines in the Fe-L complex, which makes the Ne abundance determination very sensitive to uncertainties in the temperature modeling. However, the abundance of Ne in the cores of cooling core clusters, observed with XMM-Newton with sufficiently deep exposures, can be well determined using the high spectral resolution of the Reflection Grating Spectrometers (RGS). The RGS has a higher spectral resolution than the CCDs. It resolves the Fe-L complex into individual lines and allows for accurate measurements of the equivalent widths of O, Ne, Mg, and Fe. In the case of deep observations of nearby bright, relatively cool clusters and elliptical galaxies even the spectral lines of C and N can be detected (see the right panel of Fig. 31). The high resolution transmission grating spectrometers on Chandra are because of their small effective area unfortunately not well suited for cluster spectroscopy.
 |
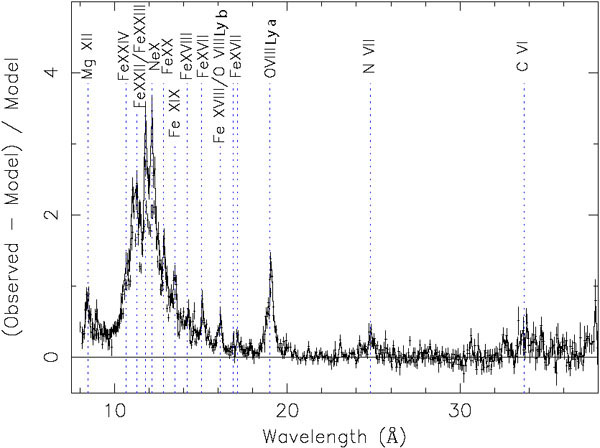 |
Figure 31. Left panel: The line spectrum of the cluster 2A 0335+096, as observed with XMM-Newton EPIC (from Werner et al. 2006b). Right panel: Line spectrum of M87, as observed with XMM-Newton RGS (from Werner et al. 2006a). This representation of the spectrum has been obtained by recalculating the spectrum with the best fit values without lines, and using the result to subtract it from the observed spectrum as indicated on the Y-axis. While the CCD spectra are plotted as a function of the observed energy, the grating spectra are shown as a function of the observed wavelength. |
|
The equivalent widths of the observed lines are under the assumption of collisional equilibrium directly converted into abundances of the corresponding elements. Because the ICM is a relatively uncomplicated physical environment (ionization non-equilibrium or optical depth effects are minimal) these abundances are relatively robust.
Abundances are often shown in the literature with respect to the outdated Solar abundances by Anders & Grevesse (1989) or with respect to newer sets of Solar and proto-solar abundances by Lodders (2003). The more recent Solar abundance determinations of O, Ne, and Fe by Lodders (2003) are ~ 30% lower than those given by Anders & Grevesse (1989). The Solar abundances of O and Ne reported by Grevesse & Sauval (1998) are higher and the abundance of Fe is slightly lower than those reported by Lodders (2003).
5.1. Early pioneering work on chemical abundances
The first evidence that the ICM is strongly polluted by metals ejected from stars in the cluster galaxies came with the discovery of the Fe-K line emission in the spectrum of the Perseus, Coma, and Virgo clusters by the Ariel V and OSO-8 satellites (Mitchell et al. 1976, Serlemitsos et al. 1977). Spectral analysis of samples of clusters observed with OSO-8 and HEAO-1 A2 showed that the ICM is enriched by Fe to 0.3-0.5 of the Solar abundance value (Mushotzky et al. 1978, Mushotzky 1984).
Until the launch of ASCA in 1993, only the Fe abundance was accurately measured in many clusters. ASCA for the first time detected emission features from many different elements (O, Ne, Mg, Si, S, Ar, Ca, Fe, and Ni) in the ICM, opening thus a new chapter in the chemical enrichment studies. While core collapse supernovae (SNCC) produce large amounts of O, Ne, and Mg, Type Ia supernovae (SN Ia) produce large quantities of Fe, Ni, and Si-group elements (Si, S, Ar, and Ca), but only very little O, Ne, and Mg. Early ASCA measurements of O, Ne, Si, S, and Fe abundances in four clusters suggested that the ICM enrichment is dominated by SNCC (Mushotzky et al. 1996). However, few years later analyzing ASCA data, Finoguenov et al. (2000) showed that while the SNCC products are uniformly distributed in the ICM, the chemical enrichment of the cluster cores is dominated by SN Ia. An interesting result based on ASCA by Fukazawa et al. (1998) and Baumgartner et al. (2005) showed that the Si abundance and the Si/Fe ratio increase from the poorer to the richer clusters, suggesting that the relative contribution of SNCC increases toward the more massive clusters. In a pioneering work Dupke & White (2000) used the abundances measured in three clusters of galaxies to put constraints on SN Ia models. They used the Ni/Fe ratio to discriminate between different SN Ia explosion scenarios available in the literature. Their work preferred the W7 "deflagration" models over the "delayed detonation" models.
The ASCA data of the Centaurus cluster were the first to show a strong Fe abundance peak at the cooling core (Fukazawa et al. 1994). Allen & Fabian (1998) used ASCA spectra and ROSAT images to show a segregation between the metallicities of clusters with and without cooling cores and suggested that it is caused by the presence of metallicity gradients coupled with the sharply peaked surface brightness profiles of the cooling core clusters. Unfortunately, the large point-spread function of ASCA did not allow to investigate the spatial abundance distributions in detail. Using the BeppoSAX satellite, which had a better spatial resolution than ASCA, De Grandi & Molendi (2001) clearly showed that while non-cooling core clusters have flat Fe abundance profiles, the metallicity distribution of cooling core clusters has a gradient with a central peak (see Fig. 32). Abundance gradients were also found in 9 out of 10 galaxies and groups of galaxies by Buote (2000a), who analyzed ROSAT data of these ~ 1 keV systems.
 |
Figure 32. The average radial distribution of the Fe abundance for a sample of cooling core (filled circles) and non-cooling core (empty circles) clusters observed with BeppoSAX (from De Grandi et al. 2004). |
ASCA data were furthermore used for a pioneering search for evolution in cluster metallicities, revealing a lack of evolution out to redshift z ~ 0.4 (Mushotzky & Loewenstein 1997, Rizza et al. 1998) and finding no evidence for a decrease at higher redshifts (Donahue et al. 1999).
5.2. Chemical enrichment in cooling core clusters
The emerging picture of the chemical enrichment in clusters of galaxies at the time of the launch of XMM-Newton and Chandra was that of an early enrichment of the ICM by SNCC, the products of which are today well mixed and homogeneously distributed, and a subsequent more centrally peaked enrichment by SN Ia which continue to explode in the cD galaxy for a long time after the cluster is formed. According to this picture the observed peaked distribution of the Fe abundance is largely due to the SN Ia in the cD galaxy.
The first abundance studies performed with XMM-Newton seemed to
confirm this scenario. The radial abundance profiles of the cooling core
cluster Abell 496 showed a flat distribution of O, Ne, Mg,
which are predominantly produced by SNCC, but a centrally
peaked distribution of Si, S, Ar, Fe, and Ni
(Tamura et
al. 2001).
However, while most of the Fe and Ni is produced by SN Ia, Si, S, Ar,
and Ca (so called  elements) are produced by both supernova types in similar
proportions. In many systems, Si has a relatively well determined
abundance value and in a cluster with a flat O profile one would expect
to see a shallower Si abundance gradient than that of Fe.
elements) are produced by both supernova types in similar
proportions. In many systems, Si has a relatively well determined
abundance value and in a cluster with a flat O profile one would expect
to see a shallower Si abundance gradient than that of Fe.
However, this has never been observed. In the most nearby cluster cooling core, M87, the Si abundance has a similar gradient as that of Fe, but at the same time it has a low O/Fe ratio in the core that increases toward the outer regions (Böhringer et al. 2001, Finoguenov et al. 2002). A similar abundance pattern was observed in the cluster sample analyzed by Tamura et al. (2004), in the Perseus cluster (Sanders et al. 2004), in Abell 85 (Durret et al. 2005), in the Centaurus cluster (Matsushita et al. 2007a, Sanders & Fabian 2006), in the group NGC 5044 (Buote et al. 2003), in Abell 1060 (Sato et al. 2007), and in AWM7 (Sato et al. 2008).
To solve this discrepancy in M87, Finoguenov et al. (2002) proposed that there are two types of SN Ia with different Si/Fe yields. Those with longer delay times and higher Si yields are today dominating the enrichment of elliptical galaxies, such as the cD galaxies in the centres of cooling core clusters, and those with shorter delay times and lower Si yields dominate the enrichment in the ICM at larger radii, because the bulk of them exploded in the time of the strongest star formation period (for more details on SN Ia models see the Subsect. 5.3).
Recently, Simionescu et al. (2009) determined radial abundance profiles for O, Si, S, and Fe in the Hydra A cluster. They found that all elements have a centrally peaked distribution. In order to investigate the radial abundance distributions in clusters in more detail, they combined their profiles with those determined for 5 other clusters with high quality X-ray data (M87, Centaurus, Fornax, 2A 0335+096, Sérsic 159-03, and Abell 1060). In the combined data set they find that the O distribution also peaks in the cluster core and decreases with radius as dO / d(logr / r200) = -0.48 ± 0.07. But the Fe abundance still decreases faster: dFe / d(logr / r200) = -0.72 ± 0.04, and therefore the fraction of O with respect to Fe increases with radius as d(O/Fe) / d(logr / r200) = 0.25 ± 0.09. The Si abundance profile, however, remains exactly the same as that of Fe, it decreases with radius as: dSi / d(logr / r200) = -0.72 ± 0.04.
Surprisingly, for the group NGC 507, Sato et al. (2009) found steep abundance gradients peaking on the cluster core not only for Si, S, and Fe but also for Mg. They also found a mildly centrally peaked abundance distribution for O. The Suzaku satellite has a better sensitivity in the O line energy and it allows for better measurements of the Mg lines in the low surface brightness cluster outskirts than XMM-Newton, which has strong instrumental lines and effective area calibration problems at the Mg energy. As shown in Fig. 33 the Mg/Fe ratio as measured with Suzaku is consistent with being flat out to 0.2r180 in Fornax (Matsushita et al. 2007a), HCG 62 (Tokoi et al. 2008), and in NGC 507 (Sato et al. 2009). Since both Mg and O are produced by SNCC their radial profiles should follow each other. However, even though the error-bars are large, the O/Fe ratio seems to increase with the radius in these three systems. The different abundance profiles for Mg and O might be due to systematic uncertainties in regions with low surface brightness where the confusion with the strong O VIII Galactic foreground line becomes an issue. The most straightforward interpretation of these profiles is that the SNCC products are also centrally peaked, as indicated by Mg, and the measured peak in the O abundance profile is shallower because of the confusion with the Galactic O VIII foreground lines which become important in the faint cluster outskirts.
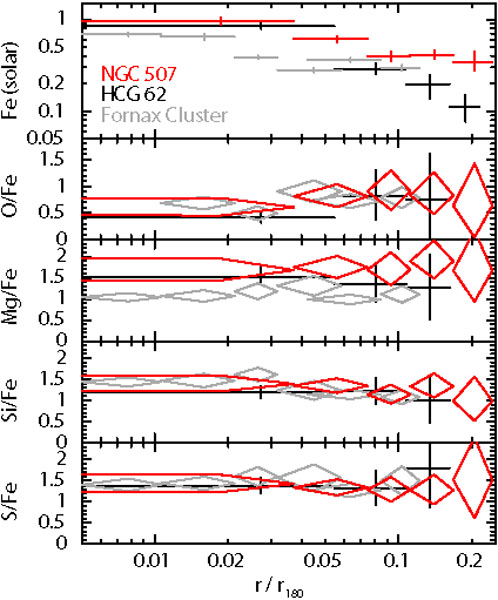 |
Figure 33. Radial profile of abundance ratios for NGC 507 (Sato et al. 2009), HCG 62 (Tokoi et al. 2008), and the Fornax cluster (Matsushita et al. 2007a). All the abundance ratios are consistent with having a flat radial profile, except O/Fe which shows an indication for an increase with the radius. The abundance ratios are in the solar units of (Anders & Grevesse 1989). |
Based on the Fe abundance profiles,
De Grandi et
al. (2004)
and
Böhringer
et al. (2004)
concluded that the central abundance peak is due to the metals released
by the stellar population of the cD galaxy. To produce the observed
abundance peaks requires long
( 5 Gyr)
enrichment times
(Böhringer et al. 2004).
In the absence of mixing the metallicity profiles should follow the
optical light profiles of the cD galaxies. But the observed metal mass
profiles are much less peaked than the optical light, which implies that
the metals get mixed and transported out to larger radii, most probably
by the AGN/ICM interaction (e.g.
Rebusco et
al. 2005,
2006).
5 Gyr)
enrichment times
(Böhringer et al. 2004).
In the absence of mixing the metallicity profiles should follow the
optical light profiles of the cD galaxies. But the observed metal mass
profiles are much less peaked than the optical light, which implies that
the metals get mixed and transported out to larger radii, most probably
by the AGN/ICM interaction (e.g.
Rebusco et
al. 2005,
2006).
The role of the AGN in the metal transport was both theoretically and
observationally best investigated in M87.
Churazov et
al. (2001)
proposed
a scenario where buoyant bubbles of radio emitting relativistic plasma,
produced by the jets of the AGN, uplift the cool metal rich gas from the
central parts of the cD galaxy. This scenario was confirmed by
observations of cool metal rich gas, distributed along the radio lobes
(see Fig. 34,
(Simionescu
et al. 2008b).
The Fe abundance of the uplifted gas (a mixture of
ICM, stellar mass loss, and SN Ia products) is ~ 2.2 times solar and its
mass is  5 ×
108
M
5 ×
108
M . It
takes 30-110 Myr to
produce the metals in the cool gas. The
relative abundances of the uplifted gas are consistent with those of the
ambient ICM, indicating that the dominant fraction of metals in the
cluster core was uplifted after the last major epoch of star formation
and the relative enrichment rate by SN Ia with respect to that by
stellar winds remains fairly constant with time. Uplift of metal rich
cool gas from the cD galaxy by buoyantly rising bubbles of radio
emitting plasma was also observed in the Hydra A cluster of galaxies
(Simionescu
et al. 2009).
The total mass of the uplifted Fe in Hydra A is 1.7 × 10⁷
M.
. It
takes 30-110 Myr to
produce the metals in the cool gas. The
relative abundances of the uplifted gas are consistent with those of the
ambient ICM, indicating that the dominant fraction of metals in the
cluster core was uplifted after the last major epoch of star formation
and the relative enrichment rate by SN Ia with respect to that by
stellar winds remains fairly constant with time. Uplift of metal rich
cool gas from the cD galaxy by buoyantly rising bubbles of radio
emitting plasma was also observed in the Hydra A cluster of galaxies
(Simionescu
et al. 2009).
The total mass of the uplifted Fe in Hydra A is 1.7 × 10⁷
M.
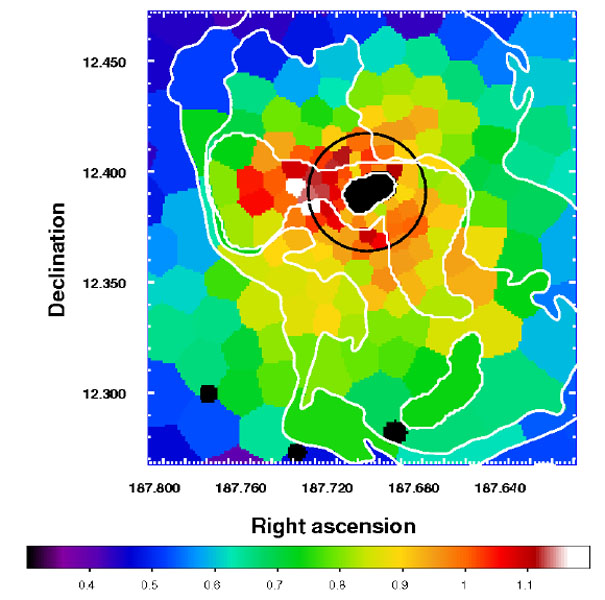 |
Figure 34. Map of the Fe abundance in M 87 in Solar units indicated under the color bar. Contours of the 90 cm radio emission (Owen et al. 2000) are overplotted. Beyond the expected radial gradient, one clearly sees the enhanced Fe abundance in the radio arms, especially within the Eastern arm (from Simionescu et al. 2008b). |
Can the abundance peaks be produced by only stellar winds and SN Ia in the cD galaxy? To explain the centrally peaked distribution of O, Si, and S in the Hydra A cluster would require the amount of metals produced by stellar winds to be 3-8 times higher than predicted by models or the metals produced by SNCC in the proto-cluster phase not to be mixed completely (Simionescu et al. 2009). Centrally peaked distribution of all elements can also be produced by ram-pressure stripping of cluster galaxies (e.g. Domainko et al. 2006). But both simulations and observations indicate that galaxies are getting stripped already at large distances from cluster cores and this mechanism probably does not contribute significantly to the observed abundance peaks on the relatively small spatial scales around the cD galaxies.
The radial metallicity gradients in cooling flow clusters often display an inversion in the center (e.g. Sanders & Fabian 2002). While an apparent drop in metal abundances can be the result of an oversimplified model in the spectral analysis of the very center of a cooling core (e.g. Buote & Fabian 1998, Molendi & Gastaldello 2001, Werner et al. 2006b, Matsushita et al. 2007a), for more discussion about spectral fitting biases see Subsect. 5.5.1) in some cases this inversion seems robust. In particular the metallicity in the Perseus cluster drops very clearly at radii smaller than 40 kpc and the central dip does not disappear when multi-temperature models and extra power-law components are introduced in the spectral fitting, or when projection effects and possible effects of resonant scattering are taken into account ( Sanders et al. 2004, Sanders & Fabian 2006, Sanders & Fabian 2007). The metallicity dips in the cluster cores may be related to the AGN/ICM feedback.
5.3. Constraining supernova models using clusters
As we mentioned before, clusters of galaxies retain all the metals produced by their stellar populations within their gravitational potential. The dominant fraction of these metals resides within the hot ICM (Finoguenov et al. 2003). All the elements from oxygen up to the iron group are primarily produced by supernovae. Their abundances within the ICM thus provide us with the integral yield of all the supernova explosions in the cluster.
Since the launch of the ASCA satellite there have been efforts to use the abundance patterns in the ICM to put constraints on the theoretical supernova models. These efforts were mainly focused on constraining the Type Ia explosion mechanisms. Dupke & White (2000)) and Dupke & Arnaud (2001) used the Ni/Fe ratio measured in clusters by ASCA to distinguish between the SN Ia models assuming slow deflagration and delayed detonation. While the deflagration explosion mechanism of SN Ia (represented by the W7 and W70 models in the literature, Iwamoto et al. 1999) predicts high Ni/Fe ratio of 2.18 to 3.22 in the Solar units of Grevesse & Sauval (1998), the delayed-detonation explosion scenarios predict significantly lower Ni/Fe ratios of 0.9-1.4 Solar. They are represented by the WDD1, WDD2, WDD3, CDD1, and CDD2 models in the literature, where the last digit indicates the density at which the flame velocity becomes supersonic (deflagration-to-detonation transition density) in units of 107 g cm-3; the "C" and "W" refer to two different central densities (1.37× and 2.12 × 10⁹ g cm-3, respectively) in the model at the onset of the thermonuclear runaway (Iwamoto et al. 1999). ASCA measured relatively high Ni/Fe ratios which clearly favored the W7 SN Ia model (Dupke & White 2000, Dupke & Arnaud 2001, see also Sect. 5.5.1).
The results based on the abundances measured by XMM-Newton, Chandra, and Suzaku are not so clear and depending on the relative abundances in the given cluster sometimes deflagration models and sometimes delayed detonation models are favored.
An excellent example of the complicated situation is the Virgo cluster with M87 in its cooling core. The abundance patterns in M87 cannot be described by any combination of SNCC and deflagration SN Ia models. The low Ni/Fe ratio and very high Si/Fe ratios clearly favor delayed detonation models. The high SN Ia yield of Si-group elements in M87 imply that the Si burning in SN Ia is incomplete, as predicted by the delayed-detonation models with lower density of deflagration to denotation transition (WDD1 model). The abundance patterns in the outer region of M 87 are on the other hand characteristic of deflagration supernova models or delayed detonation models with the highest deflagration to detonation density (WDD3). Finoguenov et al. (2002) conclude that these abundance patterns confirm the diversity of SN Ia. Today, this conclusion seems to be supported by both optical supernova surveys and more recent measurements of cluster abundances.
Optical surveys show a correlation between SN Ia properties and the
morphology of their host galaxy. While a population of brighter SN Ia
with a slow luminosity decline is more common in late-type spiral and
irregular galaxies with recent star formation (indicating a short delay
time between their formation and the explosion), a fainter and more
rapidly decaying population of SN Ia is more common in early-type
galaxies
(Hamuy et
al. 1996,
Ivanov et
al. 2000).
This is clearly seen in the Fig. 35 from
Gallagher et
al. (2005)
which shows the morphological type of the parent galaxy versus the decline
rate of SNe Ia. SNe Ia in galaxies whose populations have a
characteristic age greater than 5 Gyr are ~1 mag fainter than those
found in galaxies with younger populations. Based on the evolution of
the SN Ia rate with redshift, its correlation with the colour and radio
luminosity of the parent galaxies,
Mannucci et
al. (2006)
concluded that the delay time
distribution of SN Ia is bimodal. About half of the SN Ia explode
108 years
after the formation of the progenitor binary
system and the delay time distribution of the other half of SN Ia could
be described by an exponential function with a decay time of ~ 3
Gyr. This diversity should be reflected in the abundance yields. The
brighter supernovae are expected to produce more Ni and less
elements (Si, S, Ar, Ca) than the fainter ones.
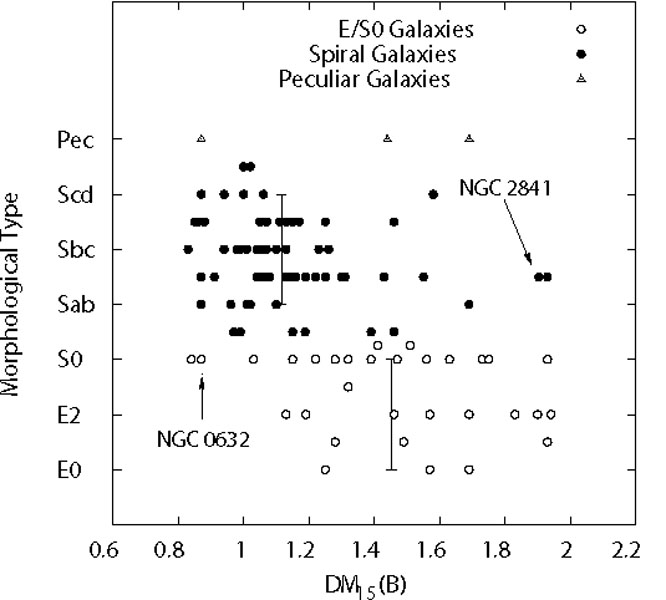 |
Figure 35. A compilation of the morphological type of the host galaxy versus the decline rate of SNe Ia. NGC 2841 has spectral features of an elliptical and NGC 0632 has emission lines characteristic for late-type galaxies. The vertical markers indicate the average decline rates for early- and late-type galaxies. From Gallagher et al. (2005). |
Fig. 36 shows the log10(Fe/Si) against the log10(Fe/O) for different spatial regions in clusters of galaxies Hydra A (Simionescu et al. 2009), Sérsic 159-03 (de Plaa et al. 2006), Centaurus (Matsushita et al. 2007a), Fornax (Matsushita et al. 2007b), M87 (Matsushita et al. 2003), and A1060 (Sato et al. 2007). The plot shows a relatively large spread in the abundance patterns determined for different clusters. In particular the differences in the Fe/Si ratio between Hydra A and M87 are striking. Each overplotted line in the figure shows a mixture of yields of a different SN Ia model with SNCC yields by Tsujimoto et al. (1995) integrated over the Salpeter IMF. Using SNCC yields by different authors, assuming different progenitor pre- enrichment levels, or integrating the SNCC yields over a different IMF would move these curves (see Fig. 11 in Simionescu et al. 2009). But an intrinsic variation in the metallicity or IMF of the SNCC progenitors alone could not explain the observed variety of abundance patterns. Thus it seems that, indeed, a variety of SN Ia flavors with different densities at the transition from the subsonic to supersonic flame velocities is needed.
While the ratio of the
elements to Fe can be different for different SNe Ia, the ratio between the
elements is very similar
for all explosion mechanisms, because the fuel (C/O) is always the same
and the burning conditions where the
elements are synthesized do
not vary much in SN Ia. Therefore the relative abundances of the
elements, especially
the Ca/Ar ratio, are the best diagnostic of the quality of SN Ia models.
de Plaa et
al. (2007)
analysed the abundance patterns of Si, S, Ar, Ca, Fe,
and Ni in a sample of 22 clusters observed with XMM-Newton
within 0.2R500. Because the SNCC do not
have a significant impact on the Ar/Ca ratio, they used the abundances
of these elements to find the best fitting SN Ia model. Delayed
detonation models clearly provide a better fit to the data than the
deflagration scenarios, but none of the supernova models by
Iwamoto et
al. (1999)
fit the Ar and Ca abundances.
de Plaa et
al. (2007)
obtained a good fit with a one-dimensional
delayed-detonation SN Ia model, calculated on a grid introduced in
Badenes et
al. (2003),
with a deflagration-to-detonation density of 2.2 × 10⁷ g
cm-3 and kinetic energy of 1.16 × 1051 ergs,
which was shown to fit best the properties of the Tycho supernova
remnant
(Badenes et
al. 2006).
Here it is interesting to note that Tycho seems to be a remnant of a fairly typical SN Ia with an average luminosity and the data points in the left panel of Fig. 36 also tend to be centred around the WDD2 model which is the closest to the best fitting model of Badenes et al. (2006). Several other observational clues point toward the delayed detonation models. Optical light curves (Woosley et al. 2007) and spectra (Mazzali et al. 2007), the X-ray emission of SN Ia remnants (Badenes et al. 2006, Badenes et al. 2008) all show that the structure of the SN Ia ejecta has to be very close to what one-dimensional delayed detonation models predict: most of the white dwarf is burnt, Fe-peak nuclei stay in the inner ejecta and the intermediate mass elements stay in the outer ejecta. The variation of the peak brightness, which correlates with the production of 56Ni and anti-correlates with the production of Si-group elements, can also be explained in the framework of the delayed detonation models by a variation of the deflagration-to-detonation transition density (transition from subsonic to supersonic flame velocities).
 |
 |
Figure 36. Intrinsic variation of cluster abundances and their average yields. Left panel: The observed [Fe/Si] versus [Fe/O] for different spatial regions of a sample of six clusters of galaxies. The curves indicate models of a mixture of SNCC products assuming a Salpeter initial mass function (Tsujimoto et al. 1995) mixed with different SN Ia products (Iwamoto et al. 1999). The dotted line connects points of the same number contributions of SN Ia to the enrichment of the ICM. The abundance patterns in the Hydra A cluster and in M87 favor very different SN Ia models. (After Simionescu et al. 2009). Right panel: Reconstruction of the average abundance patterns observed in a sample of 22 clusters of galaxies with theoretical supernova yields (from de Plaa et al. 2007). The model describing the data the best is a combination of SN Ia yields from a 1D delayed detonation model by Badenes et al. (2006) and SNCC yields for progenitors with Solar metallicities by Nomoto et al. (2006) integrated over the Salpeter IMF (from de Plaa et al. 2007). |
|
As shown by de Plaa et al. (2007) the relative abundances of chemical elements in the ICM can, in principle, be also used to distinguish between SNCC models with different level of pre-enrichment of the progenitors and with different initial-mass functions (IMF). Comparing the measured abundances with the SNCC yields predicted by the model of Nomoto et al. (2006), de Plaa et al. (2007) found that the dominant fraction of SNCC progenitors contributing to the enrichment of the ICM was already enriched and their mass distribution was close to the Salpeter IMF. The main constraints on the SNCC progenitors are based on the measured O/Ne ratio in the ICM.
While elements from O up to the Fe-group are primarily produced in supernovae, carbon and nitrogen are believed to originate from a wide range of sources: winds of short-lived massive metal rich stars, longer lived low- and intermediate-mass stars, and an early generation of massive stars (e.g. Gustafsson et al. 1999, Chiappini et al. 2003, Meynet & Maeder 2002). The ICM abundance of C and N was measured only in a few nearby bright elliptical galaxies and clusters (Peterson et al. 2003, Werner et al. 2006a). The small O/Fe ratio and large C/Fe and N/Fe found in M 87 by Werner et al. (2006a) suggest that the main sources of C and N are not the massive stars that also produce large quantities of O, but the low- and intermediate-mass asymptotic giant branch stars.
5.4. Metallicity evolution and differences between clusters
As we mentioned before, cluster data obtained by ASCA were
consistent with no evolution in the ICM metallicity out to redshift
z ~ 0.4. More recent observations with Chandra, however,
indicate a significant evolution
(Balestra et
al. 2007,
Maughan et
al. 2008).
Balestra et
al. (2007),
who investigated the Fe abundance
evolution on a sample of 56 clusters, found that while in the redshift
range of z  0.3-0.5 the average ICM Fe abundance is
0.4 Solar, above
redshift z ~ 0.5 the metallicity drops to
0.25 Solar.
Maughan et
al. (2008)
looked at a larger sample of 116 clusters at
0.1 < z < 1.3 in the Chandra archive and essentially
confirmed the results of
Balestra et
al. (2007).
They found that the abundances drop by ~ 50%
between z ~ 0.1 and z ~ 1 and the evolution is still present
if the cluster cores (the inner 0.15R500) are excluded from
the analysis. This result indicates that the abundance drop is not due
to the lack of strong cool cores at large redshifts.
0.3-0.5 the average ICM Fe abundance is
0.4 Solar, above
redshift z ~ 0.5 the metallicity drops to
0.25 Solar.
Maughan et
al. (2008)
looked at a larger sample of 116 clusters at
0.1 < z < 1.3 in the Chandra archive and essentially
confirmed the results of
Balestra et
al. (2007).
They found that the abundances drop by ~ 50%
between z ~ 0.1 and z ~ 1 and the evolution is still present
if the cluster cores (the inner 0.15R500) are excluded from
the analysis. This result indicates that the abundance drop is not due
to the lack of strong cool cores at large redshifts.
Balestra et
al. (2007)
also found a trend of the Fe abundance with the cluster temperature. Within
(0.15-0.3)Rvir in clusters below 5 keV the Fe
abundance is on average a factor of ~ 2 larger than in the hotter
clusters. The Fe abundance values measured within
0.2R500 for the sample of low redshift 22 clusters
analyzed by
de Plaa et
al. (2007)
show the same trend with the cluster temperature:
while in hot massive clusters (kT
5 keV) the Fe
abundance
seems to be constant and equal to ~ 0.3 solar, for cooler clusters, in
the temperature range of 2-4 keV, the Fe abundance shows a range of
values between 0.2-0.9 solar. This trend is probably linked to the
changing stellar mass over gas mass ratio in clusters. While the gas
mass fraction was found to, in general, increase with the cluster
temperature with a large spread of values especially below 5 keV
( Sanderson
et al. 2003),
the gas fraction in clusters above > 5 keV is constant with the ICM
temperature
(Allen et
al. 2008).
The Fe mass over light ratio seems to be constant as
a function of temperature (e.g.
Renzini
1997).
Lin et al. (2003)
find that the stellar mass fraction decreases by a
factor of 1.8 from low- to high- mass clusters, and the ICM to stellar
mass ratio increases from 5.9 to 10.4. This trend suggests a decrease of
star formation efficiency with increasing cluster mass and provides a
natural explanation for the on average lower iron abundance in the more
massive clusters. The large range of Fe abundance values in the clusters
with lower temperatures might be due to the large spread in the gas mass
fraction of the lower mass clusters and due to the range of enrichment
times and gas densities in the cool cores of clusters.
Fukazawa et al. (1998) and Baumgartner et al. (2005) showed based on ASCA data an increase of the Si/Fe ratio from 0.7 to 3 Solar in the 2-8 keV temperature range. This result was not confirmed by later XMM-Newton observations. The abundance ratios of Si/Fe, S/Fe, Ca/Fe, and Ni/Fe measured within 0.2r500 in the sample of 22 clusters with temperatures in the range of 1.5-10 keV analyzed by de Plaa et al. (2007) are consistent with being constant as a function of temperature. The intrinsic spread in the abundance ratios is smaller than 30%. This result shows that the abundance patterns do not change with the observed drop of star formation efficiency with the cluster mass and the ratios of SN Ia and SNCC contributing to the ICM enrichment are similar in clusters of all masses 2.
The observed drop of the Fe abundance with increasing redshift could be at least partly connected to the metallicity-temperature relation. The clusters observed at high redshift are primarily massive clusters which eventually evolve into hot clusters like those with lower abundances at low redshifts. The evolution of the metallicity below redshift z ~ 1 therefore might be substantially weaker than the observations suggest.
5.5. How good are the assumptions behind the abundance measurements?
The chemical abundances in the ICM are determined assuming a certain plasma model, a certain ICM temperature structure, optically thin plasma, and solar abundances for elements lighter than O or N. How good are these assumptions and how can they bias our abundance determinations?
5.5.1. How much bias due to spectral modeling?
Usually two plasma models are used for fitting cluster spectra: MEKAL (Mewe et al. 1985, Mewe et al. 1986, Kaastra 1992, Liedahl et al. 1995) and APEC (Smith et al. 2001). A more updated version of MEKAL compared to the one available in XSPEC is implemented in the SPEX spectral fitting package (Kaastra et al. 1996). MEKAL and APEC treat differently the atomic physics and differences are also in their line libraries. But despite small differences in the best fit temperature structure, the abundances derived with the two plasma codes are generally consistent within the errors (Buote et al. 2003, Sanders & Fabian 2006, de Plaa et al. 2007). The two plasma codes thus do not show any systematic inconsistencies. The implemented ionization balance for Ni is inaccurate and can significantly bias the Ni abundance measurements; an update is planned shortly for SPEX (J.S. Kaastra, private communication).
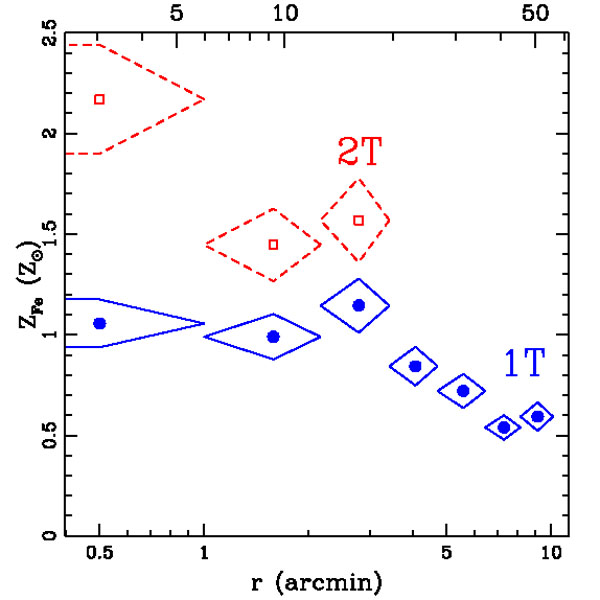
One has to be careful and keep in mind possible biases when interpreting the results of measurements of chemical abundances in clusters. The most serious biases arise when the temperature structure in the extraction region is not modeled properly. Historically, X-ray observations showed significantly subsolar abundances in galaxies and groups of galaxies. Buote & Canizares (1994) and Buote (2000b) showed that a low resolution spectrum which is composed of intrinsically two temperature components with similar emission measures, one below 1 keV and one above 1 keV, with an average temperature of about 1 keV fitted with a single temperature model will seriously bias the Fe abundance determination. Since the lower temperature component preferentially excites emission lines in the Fe-L complex below 1 keV (Fe XII-XXI) and the higher temperature component excites the Fe-L lines in the range of ~ 1-1.4 keV (Fe XXI-XXIV) the shape of the Fe-L complex will be flatter than that produced by a single-temperature model with the average temperature of the two components (see also Fig. 23). The single-temperature model can fit the flat shape of the Fe-L complex only with a relatively low Fe abundance and higher bremsstrahlung continuum. The obtained Fe abundance is thus much lower than the actual value (see the left panel of Fig. 37).
 |
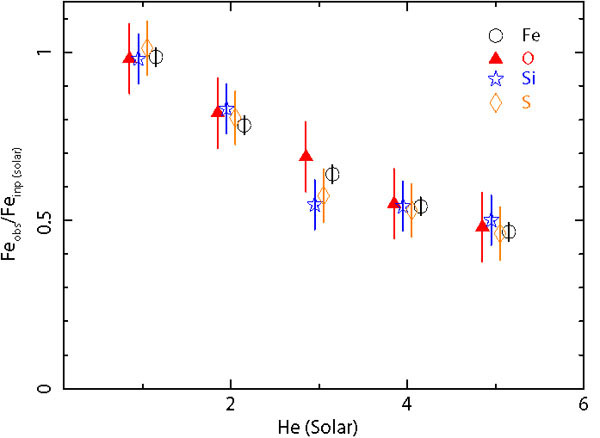 |
Figure 37. Left panel: The influence of the temperature model on the best fit Fe abundance as seen in the radial Fe abundance distribution in NGC 1399 modeled with single- and two-temperature models (from Buote 2002). Right panel: The helium abundance is usually assumed to be Solar in clusters. If the helium abundance in cluster cores is increased by sedimentation and we do not take it into account in the spectral modeling, our best fit abundances will be lower than the real values. The effect is indicated in the plot for simulated spectra of a 4 keV cluster. The simulation was made assuming a 100 ks observation with XMM-Newton EPIC and a circular extraction region with a radius of 1'. |
|
In the past few years several authors (e.g. Buote et al. 2003, Werner et al. 2006b, Matsushita et al. 2007a) showed that in the complex cool cores of groups and clusters the obtained abundances of essentially all elements increase when two-temperature models or more complicated differential emission measure (DEM) models are used instead of simple single-temperature models.
For a multi-temperature plasma with average temperatures of ~ 2-4 keV, where both Fe-L and Fe-K emission lines are seen with similar statistics, fitted with a single temperature model an "inverse Fe bias" is observed. Simionescu et al. (2009) point out that in a multi-temperature plasma at these temperatures the cool component produces stronger Fe-L lines and the hotter component emits more Fe-K emission than that expected for the single-temperature plasma with the average temperature. Therefore, by fitting a single temperature model to such plasma one will obtain a higher Fe abundance than the actual value (see also Rasia et al. 2008).
These results show that for chemical abundance studies in the ICM a good description of the temperature structure is crucial. Accurate abundance determinations require deep observations which allow to test different differential emission measure distributions to obtain the best description of the true temperature structure in the cluster cores.
5.5.2 Possible biases due to helium sedimentation?
In the gravitational potential of clusters helium and other metals can diffuse toward the cluster center (Fabian & Pringle 1977, Abramopoulos et al. 1981, Gilfanov & Syunyaev 1984). The sedimentation is more efficient for the lighter elements and in a H-He plasma, the helium is expected to be more centrally peaked than hydrogen. The helium abundance can not be directly measured. The cluster spectra are commonly modeled under the assumption of solar or primordial He abundance values in the ICM. In the inner regions of galaxy clusters where the effects of sedimentation are the most important, the underestimation of the amount of helium can cause inaccurate determination of gas densities and metallicities.
Peng & Nagai (2009) solved a set of flow equations for a H-He plasma for clusters assuming temperature profiles by Vikhlinin et al. (2006). They showed that at 0.06r500 of a 11 Gyr massive (10 keV) cluster the He/H abundance ratio can be as high as 4.3 Solar. These predictions are, however, made for unmagnetized plasma assuming no turbulent suppression of particle diffusion and no mixing in the ICM, therefore they should be treated as upper limits. Ettori & Fabian (2006) pointed out that for an actual helium abundance of ~4 times the value assumed in the spectral modeling, would cause an under-determination of the Fe abundance by a factor of 2. As we show in the righ panel of Fig. 37 the same is approximately true for the other elements as well.
5.5.3 Resonance scattering in cooling cores?
For the strongest resonant lines the ICM can be moderately optically thick (Gilfanov et al. 1987) and as we already mentioned in Sect. 3.5 resonant scattering at the energies of these lines changes the observed line intensities. This can affect the measurements of elemental abundances in the dense cores of clusters.
Sanders & Fabian (2006) constructed a model that takes into account resonant scattering for thousands of resonance lines. They tested their model on Chandra data of two clusters with central abundance dips. They conclude that metallicities in cluster cores could be underestimated due to resonant scattering by at most 10%. Resonance scattering can therefore not be the cause for the observed central abundance dips.
In order to determine the amount of resonant scattering Werner et al. (2009) studied the line ratios of the Fe XVII ion in 5 elliptical galaxies (see Sect. 3.5). They concluded that neglecting the effects of resonant scattering in the spectral fitting of the inner 2 kpc core of NGC 4636 will lead to underestimates of the chemical abundances of Fe and O by ~ 10-20%.
2 The increase of the Si/Fe ratio with the cluster temperature observed by ASCA might have been due to a bias introduced by the strong temperature gradients in the hot clusters with cooling cores. If the temperature of the best fit plasma model (the average cluster temperature) is higher than the temperature of the cooler gas with high Si line emissivity, then the model will naturally predict a higher Si abundance than the actual value. Back