


During the Astro-1 and Astro-2 missions, the Hopkins Ultraviolet
Telescope (HUT) observed six quiescent elliptical galaxies spanning a
wide range in m1550 - V
(Ferguson et al., 1991;
Brown et al., 1995;
Brown et al., 1997).
The fast focal ratio, large apertures, and
wavelength coverage down to the Lyman limit made HUT an ideal
instrument for observing extended objects and for determining the
effective temperatures of hot UV sources. The HUT spectra
(figure 1)
were inconsistent with young massive stars, having a lack of strong
C IV  1548,1551 absorption
and a declining
continuum from 1050 Å to the Lyman limit (i.e., implying
temperatures less than 25,000 K for the UV sources). Instead, the
spectra were well-matched by the integrated light expected from
populations of EHB stars and their descendents.
1548,1551 absorption
and a declining
continuum from 1050 Å to the Lyman limit (i.e., implying
temperatures less than 25,000 K for the UV sources). Instead, the
spectra were well-matched by the integrated light expected from
populations of EHB stars and their descendents.
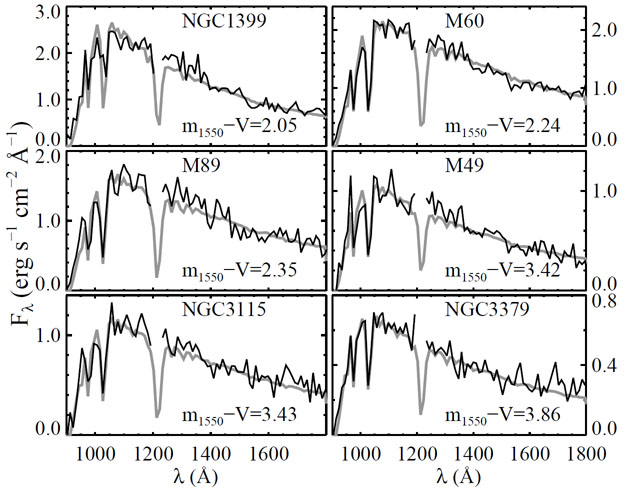 |
Figure 1. Spectra of six elliptical galaxies observed with the Hopkins Ultraviolet Telescope (black curves). Although the galaxies span a large range in m1550 - V (labeled), they all appear very similar, and are well-matched by the integrated light (grey curves) of EHB stars and their progeny, spanning a narrow range of envelope mass. |
Although the galaxies in figure 1 span nearly 2
mag in m1550 - V,
their spectra are very similar, and well fit by models with a narrow
range in envelope mass on the EHB (0.02-0.09
M ). Neither
post-AGB stars (descendents of red HB stars) or post-early AGB stars
(descendents of blue HB stars) can contribute significantly to any of
these spectra, because their spectra are respectively hotter and
cooler than those observed. This demonstrates that the strong
variations in the UV emission, relative to the optical, are the result
of variations in the fraction of EHB stars in the population, and not
a variation in the type of stars producing the UV flux. Moreover, the
HB distribution in each galaxy must be strongly bimodal, with a
significant but minority
(
). Neither
post-AGB stars (descendents of red HB stars) or post-early AGB stars
(descendents of blue HB stars) can contribute significantly to any of
these spectra, because their spectra are respectively hotter and
cooler than those observed. This demonstrates that the strong
variations in the UV emission, relative to the optical, are the result
of variations in the fraction of EHB stars in the population, and not
a variation in the type of stars producing the UV flux. Moreover, the
HB distribution in each galaxy must be strongly bimodal, with a
significant but minority
( 10%) population
of EHB stars, very few blue HB stars, and a majority population of red
HB stars.
10%) population
of EHB stars, very few blue HB stars, and a majority population of red
HB stars.
The successor to HUT, the Far Ultraviolet Spectroscopic Explorer (FUSE), has been operating since 1999. Although it observed the giant elliptical galaxy NGC1399 (in Fornax) early in the mission (Brown et al., 2002), reaction wheel failures have rendered the Virgo cluster, where nearly all nearby elliptical galaxies reside, virtually unobservable. Thus, observations of M60 were never completed, and observations of additional ellipticals are unlikely. Figure 2 shows the NGC1399 spectrum and the same best-fit EHB model that matched the HUT spectrum, but at higher resolution. Although the resolution for FUSE (0.025 Å) is much higher than that of HUT (3 Å), the velocity dispersion in NGC1399 effectively limits the resolution to ~ 1 Å. Nevertheless, the increase in resolution and signal-to-noise allows a determination of the photospheric abundances for the EHB stars driving the UV upturn. The C abundance is 2% solar, the Si abundance is 13% solar, and the N abundance is 45% solar.
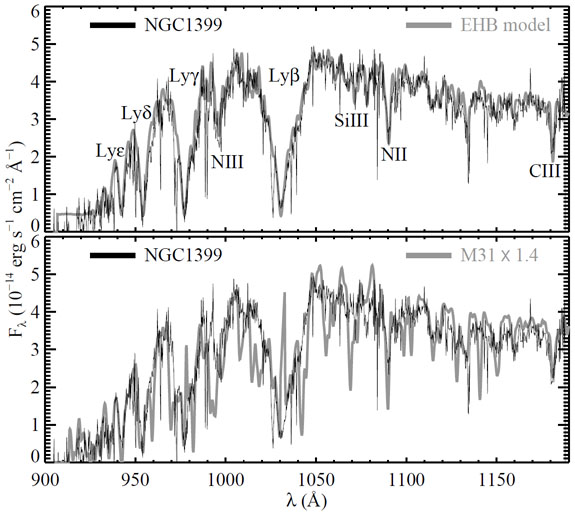 |
Figure 2. Top panel: The FUSE
spectrum of NGC1399 (black
curve) is compared to the best-fit EHB model (grey curve) from
the earlier analysis of HUT data. Photospheric features are labeled;
note the sharp Galactic interstellar features to the blue of several
photospheric features. Bottom panel: The NGC1399 spectrum
(black curve) is compared to the renormalized M31 spectrum
(grey curve), convolved to the NGC1399 velocity
dispersion. Although strong interstellar features complicate the
analysis of the M31 spectrum, the C III
|
The UV upturn is positively correlated with optical metallicity indicators, contradicting the general tendency for the HB morphology to become redder at increasing metallicity. This has led to considerable debate about the metallicity of the hot stars responsible for the UV emission. In particular, Park & Lee (1997) have argued that the UV upturn should be anticorrelated with the metallicity of the hot stars. In their view, the correlation between UV upturn and optical metallicity indicators is due to the more metal-rich galaxies being older and more massive. Others (e.g., Greggio & Renzini, 1990; Bressan et al., 1994) have argued that the tendency for redder HB morphology at increasing metallicity is reversed at high metallicities, because of an associated increase in helium abundance and perhaps enhanced mass loss; in this case, the UV upturn should positively correlate with both optical and UV metallicity indicators. The metallicity of the EHB stars in NGC1399, the galaxy with the strongest known UV upturn, is clearly neither metal-rich nor metal-poor.
The surface abundance pattern of the EHB stars, derived from the UV
spectra of elliptical galaxies, is probably affected by diffusion in
the stellar atmospheres, as often found for sdB stars in the Galactic
field. Nevertheless, it is still interesting to compare the
metallicity in UV-strong galaxies with UV-weak galaxies, to look for
general trends. Unfortunately, FUSE did not observe the UV-weak giant
elliptical M49 before the onset of its hardware problems, and the
spectrum of the nearby galaxy M32 is of very low signal-to-noise.
Given the inability to point at Virgo, we replaced M49 in our program
with the bulge of M31, which also has a fairly weak UV upturn. Its
spectrum is shown in figure 2; because the bulge
of M31 does not have
the high velocity dispersion of NGC1399, the M31 spectrum has been
convolved and renormalized appropriately for comparison. The spectrum
of M31 is much more difficult to interpret than that of
NGC1399; the
redshift of NGC1399 separates the weak Galactic interstellar lines
from the EHB photospheric lines, while the slight blueshift of M31 is
not enough to separate these lines. Unlike NGC1399, which suffers
from no foreground extinction, the foreground extinction toward the
M31 nucleus is much stronger: E(B -
V) = 0.08 mag
(Schlegel et al., 1998).
Nevertheless, a few photospheric features have no interstellar
counterpart, such as C III
1175. This feature shows
that the C abundance in M31 is also very weak - perhaps weaker than
that in NGC1399. In general, the continuum shape is very
similar in the two spectra. However, after dereddening, the M31 spectrum would
appear somewhat hotter than the NGC1399 spectrum, suggesting a
contribution from either hotter EHB stars and/or a higher contribution
from post-AGB stars.