


An important factor in the confusion about the nature of NGC 5128 was its apparent lack of globular clusters. By the late 1970s studies of galaxies beyond the Local Group had found globular clusters (GCs) in every galaxy searched, and shown that large E galaxies contained thousands of GCs (cf. Harris & Racine 1979 and references cited therein). But in the case of NGC 5128 no such GC population had been uncovered.
van den Bergh (1979) carried out star counts in annuli between 45" (~ 800 pc) and 484" (~ 9000 pc) (cf. Figure 2), finding an excess of only 15 ± 60 objects above background. An obvious explanation for the apparent lack of GCs in NGC 5128 was the dust lane and its signalling of a cataclysmic history. We now know that the GCs are present in numbers expected for an E galaxy in a small group (e.g. Harris et al. 1984, Harris et al. 2004b). But they are hard to separate unambiguously from the noise of foreground Milky Way halo stars and compact background galaxies. The two main reasons for this are proximity and low Galactic latitude. At a distance of 3.8 Mpc, 1' corresponds to ~ 1100 pc and, consequently, a survey to discover a widely distributed population like globular clusters must cover an area of more than two square degrees. Observationally this is a major challenge, but that is not the worst.
 |
Figure 2. Star counts in NGC 5128 based on data from van den Bergh (1979). |
Since globular clusters in galaxies well beyond the Local Group generally appear starlike, they cannot be distinguished from either foreground field stars or background galaxies by appearance alone. To reduce contamination, we start by using the fact that clusters occupy a well defined range in colour and luminosity to detect them photometrically and eliminate a large fraction of non-cluster sources.
But, for NGC 5128 this is nearly useless. Its brightest GCs should appear at an apparent magnitude of V ~ 17 while the peak of the GC luminosity function (GCLF) would be seen at a magnitude of V ~ 21. Because of NGC 5128's low Galactic latitude (19°) we see it through the Milky Way halo and disk and its mainly late type stars whose colours and apparent magnitudes will fall in the same range as GC candidates. Compact background galaxies which are fairly easily seen through the dilute halo may also have GC-like colours and surveys show that their numbers begin to increase rapidly at V ~ 20-21, just at the GCLF peak (Metcalfe et al. 2001). In short, the sample contamination problem is extraordinarily difficult to solve.
The GC mystery began to disappear with the discovery by Graham & Phillips (1980) of a globular cluster candidate ~ 8.2' northeast of the galaxy centre. This was followed quickly with the identification of six more (van den Bergh et al. 1981). All seven were initially selected by their slightly non-stellar appearance and then confirmed spectroscopically as having radial velocities consistent with membership in NGC 5128. Using Schmidt plates with a much larger field of view than the 4-m prime focus plate used by van den Bergh (1979), van den Bergh et al. (1981) also revisited the question of star counts. Their results, reproduced in Figure 3, show a clear excess of objects within ~ 375" of the nucleus; based on this they estimated the total cluster population at 600 ± 61. Later wide field surveys have estimated the total GCS population at ~ 1000-2000 (Harris et al. 1984, 2004b)
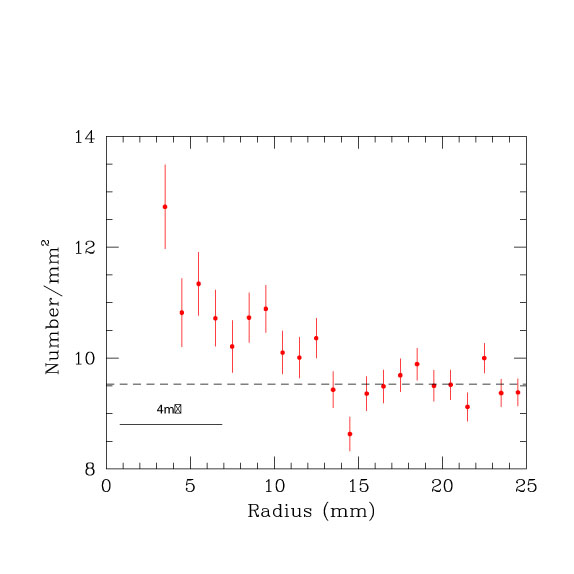 |
Figure 3. Surface density of objects plotted vs. distance from the centre of NGC 5128, adapted from van den Bergh (1979) (Figure 2); note the line labeled 4m indicating the area counted previously by van den Bergh (1979). |
Once the existence of globular clusters in NGC 5128 was established,
increased efforts were made to understand this system. But the
observational issues described above have made it extremely difficult to
build an overall picture. To illustrate this I have plotted a historical
overview in Figure 4. Shown plotted vs. year
are: estimates of the total GC population
(van den Bergh 1979,
van den Bergh et
al. 1981,
Harris et al. 1984,
2004b)
and this paper); number of confirmed GCs
(Graham & Phillips
1980,
van den Bergh et
al. 1981,
Hesser et al. 1986,
Rejkuba et al. 2001,
Peng et al. 2004b,
Woodley et al. 2005,
2007,
Beasley et al. 2008,
Woodley & Gomez
2010b);
and, for comparison, the number of confirmed planetary nebulae
(Jacoby, Ciardullo,
& Ford 1988,
Ford et al. 1989,
Hui et al. 1993,
Peng et al. 2004a,
Walsh et al. 2010).
Note that the number of known GCs reaches a plateau at ~ 100 in the late
1980s and remains virtually unchanged for more than a decade. This
reflects the
fact that the "easy" GC candidates which could be identified by a slightly
non-stellar appearance had pretty much been found. And remember,
adding more to the sample by photometry alone is an almost impossible task
for ground based seeing, while the large angular scale of the system
precludes HST imaging due to its small field of view.
In their wide field imaging study
Harris et al. (2004a)
found ~ 105 objects which
fell in the colour and magnitude range populated by globular clusters in
NGC 5128. If the total cluster population is ~ 2000,
it is embedded in
a S/N of 0.02; i.e. only about 2% of the detected star-like objects
in the field encompassed by the halo of NGC 5128 are likely globular
clusters. Recent increases in the number of known clusters have been
achieved by the brute force approach of obtaining radial velocity
spectra for the brightest candidates
(Beasley et al. 2008,
Woodley et al. 2005,
2007,
2010a)
and the number of confirmed GCs is now 607.
(Woodley et al. 2010a)
fit a Gaussian to the luminosity function (LF) of
their sample, finding a turnover of T1 (to) =
19.44 mag.
This is almost 1 mag brighter than the expected value and a clear sign that
this sample is missing most of the fainter clusters. Because both the
distance to NGC 5128 and the absolute magnitude of the standard
globular
cluster luminosity function (GCLF) turnover are well known we can force
a fit to the cluster sample, assuming it is complete for the brightest
clusters, and estimate the total population of the cluster system,
Nt. With (m - M)0 = 27.9
(Harris et al. 2010),
AV = 0.35
(Schlegel et
al. 1998),
and MV (to) = -7.3 for giant ellipticals
(Harris 2001)
the GCLF turnover should occur at V = 20.95 or
T1 = 20.47. Fitting a Gaussian
function with  = 1.4,
typical of gE's
(Harris 2001)
yields the result shown in Figure 5, from which
we estimate Nt = 1300 ± 300.
= 1.4,
typical of gE's
(Harris 2001)
yields the result shown in Figure 5, from which
we estimate Nt = 1300 ± 300.
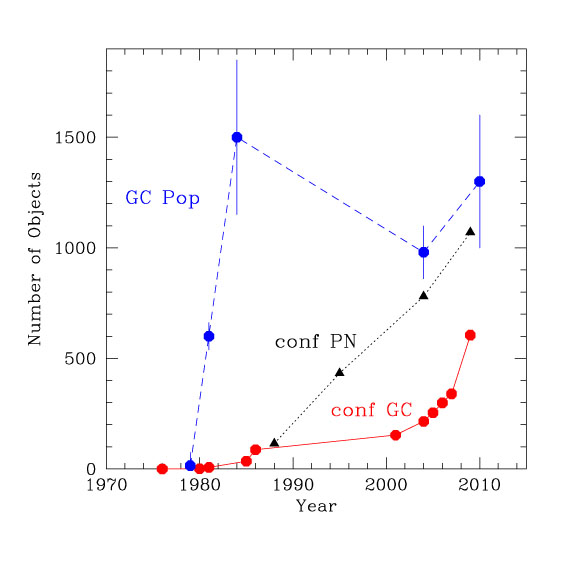 |
Figure 4. Plotted are estimates of total GC population (blue), GCs confirmed by radial velocity and/or resolved by HST imaging, and confirmed planetary nebulae. If the estimated total number of GCs in NGC 5128 is correct (cf. Figure 5 and accompanying text), then we have now identified ~ half of the GC population. |
This value is consistent with previous estimates, but is based on a more
secure data set, especially for the brightest clusters, and stronger
constraints on the distance to NGC 5128. From
Figure 5 it is also clear
that roughly half the GC population is now known, and that almost all of
the undiscovered clusters will be fainter than V ~ 20 or
T1 ~ 19.5.
Finally, we can calculate the specific frequency
SN = Nt
100.4(MVT + 15)
(Harris & van de
Bergh 1981).
Combining Nt = 1300 ± 300 and
MVT = -22.1
(Harris et al. 2004b),
gives SN = 1.9 ± 0.5.
Disk galaxies typically have low SN
 1.5, E
galaxies have SN ranging from 1-10 and even higher,
while field E galaxies are on the lower end of
this range with SN
2
(Harris 2001).
Thus SN ~ 2 for NGC 5128
is consistent with a normal GCS in a small group.
1.5, E
galaxies have SN ranging from 1-10 and even higher,
while field E galaxies are on the lower end of
this range with SN
2
(Harris 2001).
Thus SN ~ 2 for NGC 5128
is consistent with a normal GCS in a small group.
 |
Figure 5. Gaussian function superimposed on the NGC 5128 globular cluster luminosity function using data from Woodley et al. (2010a). |
3.2. GCS Metallicities and Ages
Harris et al. (1992) obtained Washington photometry to derive metallicities for 62 GCs based on C - T1 colours. The results (Figure 6) showed a broad, bimodal metallicity distribution with a mean [Fe/H]C - T1 = -0.8 ± 0.2. None of the clusters showed the extreme, greater than solar abundances found by Frogel (1984) based on JHK photometry and it appears likely that these values were due to the difficulty of calibration of colour-metallicity relations at such high abundances.
As the number of confirmed GCs has grown the "simple" bimodality
of the MDF has become less clear (e.g.
Harris et al. 2004a,
Peng et al. 2004b,
Beasley et al. 2008,
Woodley et al. 2010a)
and references therein). But the breadth
of the GCS colour distribution and its high mean metallicity
have not changed. In addition, we now have chemical abundances and
ages based on high S/N spectra which are helping to disentangle
the frustrating age/metallicity degeneracy endemic to purely
photometric studies.
Beasley et al. (2008)
and
Woodley et al. (2010a)
have found that the majority of clusters, both metal-rich and
metal-poor, are old (> 8-10 Gyr). The GCS has a subpopulation
of younger clusters (< 3-5 Gyr) but virtually no extremely young
members. The clusters are
 -enhanced above solar,
but not as strongly as seen for Milky Way globulars.
-enhanced above solar,
but not as strongly as seen for Milky Way globulars.
The structures of Milky Way globular clusters are well described
by single mass, isotropic King models
(King 1962)
and occupy a narrow range of parameter space similar to the fundamental
plane for elliptical galaxies
(Djorgovski 1995).
McLaughlin (2000)
has shown that the clusters have a common core M/L and that
there is a strong correlation between core binding energy
and cluster luminosity.
Barmby et al. (2007)
and
McLaughlin et
al. (2008)
have shown that the GCs in both M31 and NGC 5128 follow the same fundamental plane for
clusters as massive as ~ 3 × 10⁶
M ,
suggesting that old GCs have similar structural properties in all
galaxies. Studies of the most luminous GCs in other systems
(Hasegan et al. 2005,
Rejkuba et al. 2007)
suggest that they bridge the gap between
lower mass (normal) clusters and compact dwarfs (UCDs)
(Mieske et al. 2008).
With a total population ~ 10 × that in the Milky Way, the
NGC 5128 GCS is an important resource for exploring
how structures and M/L ratios change for the most massive clusters.
,
suggesting that old GCs have similar structural properties in all
galaxies. Studies of the most luminous GCs in other systems
(Hasegan et al. 2005,
Rejkuba et al. 2007)
suggest that they bridge the gap between
lower mass (normal) clusters and compact dwarfs (UCDs)
(Mieske et al. 2008).
With a total population ~ 10 × that in the Milky Way, the
NGC 5128 GCS is an important resource for exploring
how structures and M/L ratios change for the most massive clusters.