


Bars are common in galaxies: around one third of all disk galaxies have a strong bar, and when including weak bars and ovals, the fraction of barred galaxies rises to well over two-thirds (references in the introductory section). The bar fraction is roughly invariant with morphological type across the spirals (Knapen et al. 2000), but lower in the S0s (Barazza et al. 2008; Laurikainen et al. 2009). There is an interesting debate in the literature over whether the fraction of bars is lower (Abraham et al. 1999; van den Bergh et al. 2002; Sheth et al. 2008) or not (Elmegreen et al. 2004; Jogee et al. 2004; Zheng et al. 2005) at the highest redshifts where bars can be reliably recognised, around z ~ 1. Nair & Abraham (2010) find that the fraction of barred spiral galaxies between redshifts of 0.01 and 0.1 is a strong function of stellar mass and star formation history. They suggest that the discrepancy in the reported bar fraction evolution with redshift may have its origin in observational biases and selection criteria, because the strong bar fraction is sensitive to the mass range that is being probed (see also Cameron et al. 2010, who find that the early- and late-type bar fractions vary with redshift and galaxy mass).
Bars are efficient agents of angular momentum transfer in galaxies, and are expected to evolve as they transfer angular momentum to the disk and the halo, and allow the radial inflow of gas (e.g., Lynden-Bell & Kalnajs 1972; Sellwood 1981; Shlosman et al. 1989, 1990; Debattista & Sellwood 1998; Athanassoula 2002, 2003; Martinez-Valpuesta et al. 2006). As a result, bars should slow down and grow over time, and become longer, thinner, and stronger (Athanassoula 2003). As bars are relatively easy to observe, they can be used as effective probes of secular evolution in galaxies.
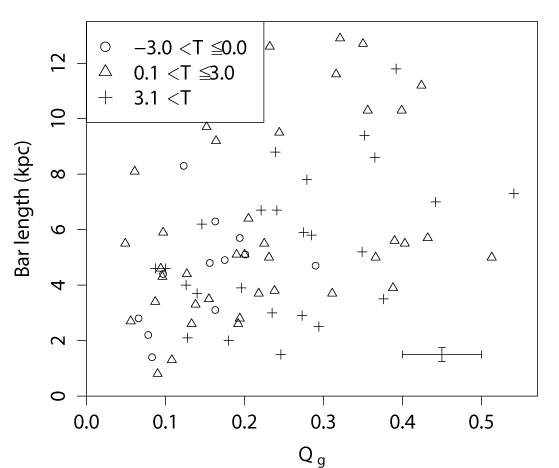
To study their basic properties and the relations to their host galaxies, bars are parametrized by determining their main parameters, such as length, thickness, and strength. Many different definitions of such parameters can be devised and have been presented in the literature, but modern analyses use techniques such as image decomposition, Fourier analysis, and the determination of bar strength parameters from deep high-quality images. This is done preferably in the infrared where light traces mass better than in the optical, and where the effects of dust extinction are greatly reduced. As an illustration of the kind of relations that are being found, we show in Fig. 1 the measurements that have been obtained by Comerón et al. (2010) as part of their Atlas of Images of Nuclear Rings (AINUR), of which we will later review more results on nuclear rings. This is not an unbiased survey, but its results do illustrate the points we wish to highlight here.
 |
 |
 |
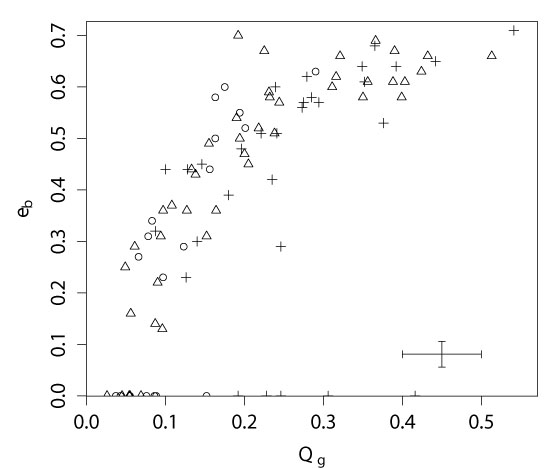 |
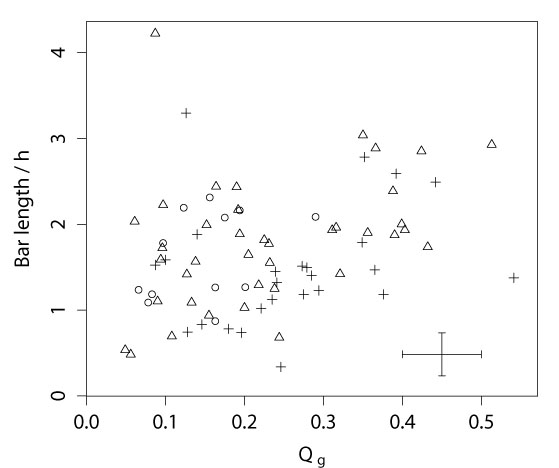
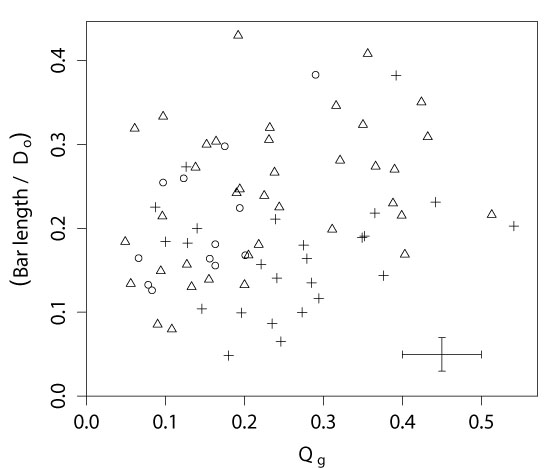
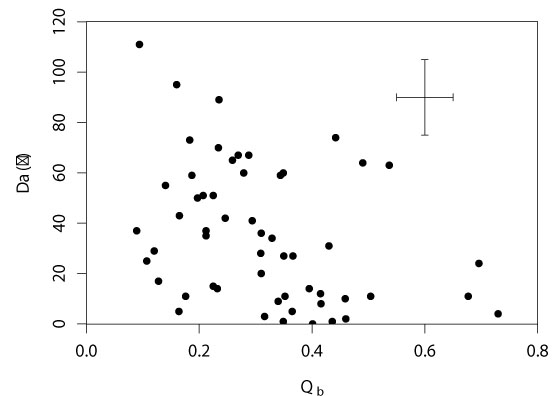
Figure 1. Bar length and bar ellipticity (the latter in the lower right panel) as a function of the bar strength parameter Qg, for 107 nuclear ring host galaxies. The top left panel shows the absolute bar length, the top right panel the bar length normalised by the scale length of the exponential disk, and the bottom left panel the bar length normalised by the disk size. Typical uncertainties are indicated in each panel, and the symbol styles indicate different morphological types as shown in the top left. Reproduced with permission from Comerón et al. (2010). |
|
Fig. 1 shows various measures of the length of the bar, as well as ellipticity, as a function of the bar strength parameter Qg, and indicating three ranges of morphological types. Qg is a non-axisymmetric torque parameter, quantifying the impact of non-axisymmetries in a galaxy by measuring the maximum value of the tangential forces normalized by the axisymmetric force field (e.g., Combes & Sanders 1981; Quillen et al. 1994; Salo et al. 1999; Block et al. 2001; Buta & Block 2001; Laurikainen & Salo 2002) 1. Comerón et al. (2010) determined Qg values using azimuthal Fourier decomposition and polar integration (following Salo et al. 1999 and Laurikainen & Salo 2002).
The data points are from a sample of 107 galaxies hosting nuclear rings (Comerón et al. 2010). They confirm the general trend, already noted by Martinet & Friedli (1997) and Laurikainen et al. (2004b), among others, for bars to become longer as they become stronger, but the scatter is rather large. This conclusion can be drawn from any of the three bar length measures plotted, directly in units of kpc, and normalised by the disk scale length h or the disk size D0. Two regions of the various diagrams in Fig. 1 are empty, which seems to indicate that there are no very strong short bars, nor any very weak and long ones. In fact, some late-type galaxies do have short bars with large Qg, due to the fact that they have very little, or no, bulge to dilute the non-axisymmetric contribution of the bar to the potential (e.g., Laurikainen et al. 2004b). This effect also explains why Qg decreases but the bar length increases towards the earlier Hubble types (Buta et al. 2005; Laurikainen et al. 2007; Fig. 1). The bar ellipticity is seen to increase monotonically with Qb (Buta et al. 2004), with some scatter but very few outliers.
From deep Ks-band images of 20 galaxies, Elmegreen et al. (2007) confirmed independently that longer bars are stronger (as indicated in their paper by the peak amplitude of the normalised m = 2 Fourier component). They also found an interesting correlation between the bar length and an increased density in the central parts of the disks. Elmegreen et al. note that, as dense galaxies evolve faster, these results indicate that bars grow in length and amplitude, with the densest galaxies showing the fastest evolution. Numerical modelling provides theoretical support for correlations such as the one between bar strength and length (see, e.g., the recent simulations by Villa-Vargas et al. 2010, with varying gas fractions and gas spatial resolution).
Other aspects of bars which are directly related to secular evolution include the frequency of ansae-type morphology, significantly enhanced in early-type galaxies (Laurikainen et al. 2007; Martínez-Valpuesta et al. 2007); the finding that bars with double-peaked amplitude profiles are stronger than those with single-peaked profiles (Buta et al. 2006), and occur more frequently in early-type galaxies than in spirals (Laurikainen et al. 2007), which might indicate that they are more evolved (Athanassoula & Misioritis 2002; Athanassoula 2003); and the fact that most S0s have lenses (Laurikainen et al. 2007).
A further hint at the internal physical processes in bars is provided by the study of dust lanes of Comerón et al. (2009). Dust lanes have been recognised in relation to shocks in the flow of gas in barred galaxies now almost 50 years ago (Prendergast 1962), and Athanassoula (1992) in fact predicted from numerical modelling that the degree of curvature of the main dust lanes in a bar should decrease as the bar gets stronger: stronger bars have straighter dust lanes. As dust lanes are clearly visible in barred galaxies (e.g., Pease 1917; Sandage 1961), this is in principle an easily observable tracer of the fundamental physics and dynamics of galactic bars, yet with the exception of the preliminary study by Knapen et al. (2002) of only nine galaxies which confirmed the predictions, it had never been tested observationally. Comerón et al. (2009) collected images of 55 bars of which the shape of the dust lanes could be measured, and for which the bar strength Qb was available from the literature.
The predicted correlation can indeed be recognised in their results, reproduced here in Fig. 2 (left panel). But the line which would indicate a linear relationship between stronger bars and less curved dust lanes is, in fact, only the upper envelope to the distribution of points. This is not scatter, as indicated by the typical uncertainties of each data point. The strength of the bar does not prescribe the degree of curvature that the dust lanes can have, but instead only provides an upper limit. Hence, strong bars can only have straight dust lanes, whereas weak bars allow their dust lanes to be either curved or straight.
 |
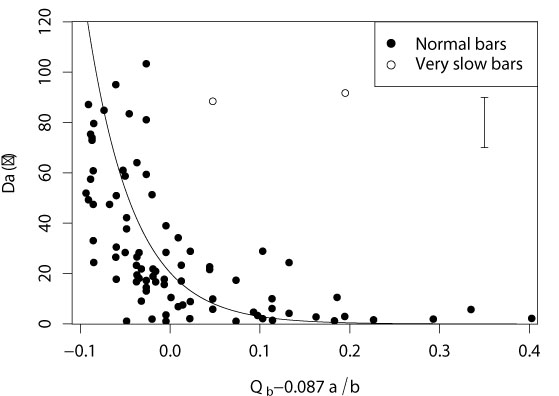 |
Figure 2. Dust lane curvature as a function of bar strength parameter Qb for 55 observed galaxies (left panel), and, for a set of 88 modelled galaxies, as a function of a combination Qb and the bar ellipticity parameter a/b which minimizes the spread. The curve indicates the best fit to the `normal' bars. Reproduced with permission from Comerón et al. (2009). |
|
To investigate what factor other than the bar strength might cause the degree of curvature of the dust lanes, Comerón et al. (2009) analysed a set of 238 simulated galaxies, in 88 of which the dust lane curvature could be measured. The results of this, as shown in the right panel of Fig. 2, show that the scatter can be greatly reduced when the bar strength is described as a linear combination of Qb and a / b, the quotient of the major and minor axes of the bar. These are both bar parameters, and since no other parameters (describing, e.g., the bulge) could be identified that reduce the scatter in the original diagram, this is proof that indeed the dust lane curvature is predominantly determined by the parameters of the bar. Just how the linear combination of Qb and a / b, as plotted in Fig. 2, must be interpreted is an interesting question that remains to be explored further.
Bars also affect the disk regions outside them. This is perhaps best seen in the way they drive spiral density waves. That they do is expected from theory and numerical modelling, but also in this case it has been hard to confirm observationally. Previously, various observational links between bars and spirals had been reported (e.g., Kormendy & Norman 1979; Elmegreen & Elmegreen 1982), but more recent works have reported either good (Block et al. 2004), some (Buta et al. 2005, 2009), or no correlation (Seigar et al. 2003; Buta et al. 2009; Durbala et al. 2009) between bar and spiral strengths. The reasons for the discrepant results include sample size, methodology, and data quality, as summarised by Salo et al. (2010). The latter authors re-investigated this problem using the same data which had led Buta et al. (2005, 2009) to inconclusive results, but using a novel analysis approach.
Salo et al. (2010), rather than compare maxima of bar strength and spiral density amplitude, compare the local bar forcing and spiral amplitude as a function of distance. As reproduced in Fig. 3, this yields a correlation between bar forcing and spiral amplitude, strongest near the ends of the bar, but statistically significant up to one and a half times the bar radius. This confirms that the stellar spirals represent a continuation of the bar mode, or are driven by the bar through some mechanism. Outside the region of influence of the bar, the spirals may be independent modes, or transient. As the correlation between bar and spiral is similar for early- and late-type spirals, and for small and large bars, Salo et al. (2010) conclude that the forcing of the spiral by the bar is a general occurrence.
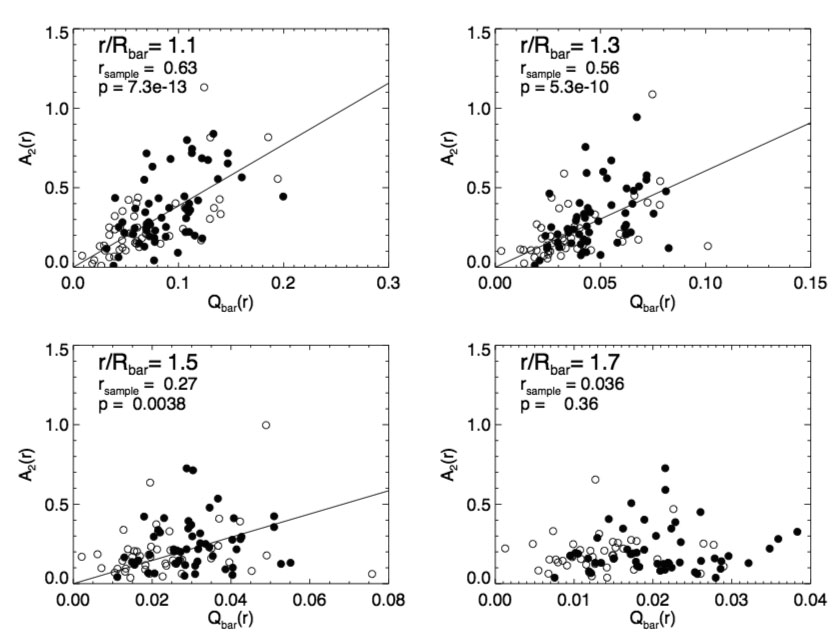 |
Figure 3. Relation between the local bar forcing (Qbar(r)) and the local spiral amplitude (A2(r)) for 103 barred galaxies, and at four distances r / Rbar, normalised to the bar length. The values rsample and p indicate the correlation coefficient and significance; the best fit is indicated by a line in the three cases of highest significance. Open and filled symbols indicate short and long bars and yield the same distribution. Reproduced with permission from Salo et al. (2010). |
2.4. Bars and secular evolution
As a final illustration of the possible use of bars as tracers of secular evolution in galaxies, we cite the recent work by Buta et al. (2010a). These authors use images from the Near-Infrared S0 Survey (NIRS0S; Laurikainen et al. 2005; Buta et al. 2006; Laurikainen et al. 2006) with similar images of spirals from the literature to study the bar strength distribution in lenticular as compared to spiral galaxies. This is a pertinent question because lenticular galaxies remain somewhat of an enigma. They have been positioned between ellipticals and spirals in galaxy classification schemes since the earliest work by Hubble (1926), and one of the main questions is whether the S0 galaxies are more closely related to elliptical or spiral galaxies.
In modern Lambda Cold Dark Matter
( CDM) cosmology,
ellipticals
and the bulges of spirals are formed early in the evolution of the
Universe by mergers, and their properties were thus established already
early on. In this framework, S0s may either be formed as ellipticals, or
alternatively they may be transformed spirals, formed as the disks have
lost their gas by some stripping mechanism. In a recent paper also based
on NIRS0S images,
Laurikainen et al. (2010)
confirm from photometric
scaling relations that the formative processes of bulges and disks in
S0s are coupled, and that the bulges of S0s are similar to those of
spirals with bright bulges. They conclude that spiral galaxies with
bulges brighter than
MK(bulge) < -20 mag can evolve
directly into S0s, due to stripping of gas followed by truncated star
formation. This is prima facie evidence for secular evolution.
CDM) cosmology,
ellipticals
and the bulges of spirals are formed early in the evolution of the
Universe by mergers, and their properties were thus established already
early on. In this framework, S0s may either be formed as ellipticals, or
alternatively they may be transformed spirals, formed as the disks have
lost their gas by some stripping mechanism. In a recent paper also based
on NIRS0S images,
Laurikainen et al. (2010)
confirm from photometric
scaling relations that the formative processes of bulges and disks in
S0s are coupled, and that the bulges of S0s are similar to those of
spirals with bright bulges. They conclude that spiral galaxies with
bulges brighter than
MK(bulge) < -20 mag can evolve
directly into S0s, due to stripping of gas followed by truncated star
formation. This is prima facie evidence for secular evolution.
The bar strength distribution of Buta et al. (2010a) shows (Fig. 4) that S0 galaxies on average have weaker bars than spiral galaxies in general, and even than early-type spirals, of type S0/a and Sa. Several studies, mostly based on contrast, have shown that bars in early-type galaxies are stronger and longer than those in later-type galaxies (e.g., Elmegreen & Elmegreen 1985), other studies report weaker bars in lenticulars as compared to spirals (e.g., Aguerri et al. 2009, who used a strength measure based on bar ellipticity). When considering the gravitational forcing of the bar, as measured, e.g., through the Qb parameter, the non-axisymmetric bar forcing is to a large extent cancelled in early-type galaxies by the axisymmetric contribution to the potential of their more massive bulges (e.g., Laurikainen et al. 2004b), so that in early-type galaxies bars are longer and have larger A2-amplitudes, but have lower Qg and ellipticity than spiral galaxies (Laurikainen et al. 2007).
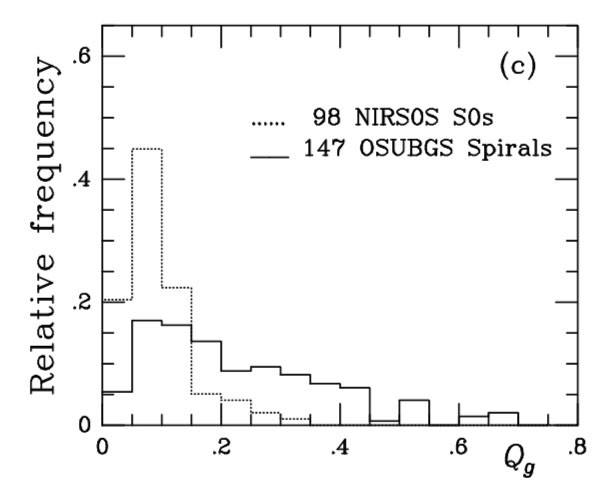 |
Figure 4. Histograms of the bar strength distribution in S0 and spiral galaxies. Reproduced with permission from Buta et al. (2010a). |
The differences found by Buta et al. (2010a) are significant, and only partly due to the dilution of the bar torques by the large bulges of the S0s, or the thicker disks in S0s. They tell us that if indeed S0s have evolved from spirals, the bar evolution must have continued after the gas depletion, which might also be suggested by the lower frequency of bars (Laurikainen et al. 2009) and the higher frequency of lenses (Kormendy 1979; Laurikainen et al. 2007) in S0s as compared to spirals. Buta et al. (2010a) speculate that the bars in early-type galaxies can be slightly skewed, so that a potential-density phase shift (Zhang & Buta 2007) can evolve the stellar distribution, leading to continued bulge building and bar weakening.
1 Note that Qg is measured across a whole galaxy and may include contributions from the spiral arms as well as the bar. In earlier work, what we now refer to as Qg was called Qb. In more modern work, we refer to Qb as the non-axisymmetric torque from the bar only, after separating the contributions of bar and spiral arms (e.g., Buta et al. 2006). In early-type galaxies, including S0s, the spiral arm contribution is very small and Qg can be used as Qb. Back.