


There are essentially two approaches to the problem of modelling the transfer of radiation in galaxies and the interaction between dust particles and photons. The first approach is to use multiwavelengths observations as a starting point and build models that can be directly applied to the panchromatic observations to decode their information. These are the SED model tools, which perform a direct translation between observed quantities and physical quantities, for example to derive intrinsic distributions of stellar emissivity and dust in galaxies and to derive intrinsic physical parameters like dust opacity and SFRs. Then the physical quantities can be compared with predicted physical quantities derived from theory. We call this process decoding observed panchromatic SEDs:
Observed SEDs -> Physical Quantities <-> Predicted Phys. Quantities <- Theory
|
|
decode
compare
A second approach is to start with a theory, in other words to assume “one knows how galaxies form”, and make predictions for some physical quantities, e.g. to use as a starting point a simulation of a galaxy instead of an observation. Subsequently a model that can deal with the dust physics and the transfer of radiation in the given simulation needs to be applied to obtain simulated panchromatic images of a galaxy for comparison with observations. The applied model is again a SED model tool, except that this works in the opposite direction from the previous approach. We call this process encoding predicted physical quantities:
Theory -> Predicted Physical Quantities
-> Predicted SEDs <-> Observed SEDs
|
|
encode
compare
Obviously it is more difficult to decode than to encode. For example in the decoding process one needs to constrain the geometry of the problem, while in the encoding process the geometry is provided directly from theory. Nonetheless, the second approach relies on the assumption that the theory is correct, while in the first approach some geometrical components can be constrained empirically. Since both approaches are needed, we would like both approaches to converge towards a unique solution.
3.1. Decoding panchromatic SEDs
There are several essential steps included in any self-consistent model for the transfer of radiation and dust reprocessing. As mentioned before, one of the essential steps is the specification of geometry, which means the specification of the distributions of stellar emissivity and dust, both on kpc scales and on pc scales. Components that are seen through optically thin lines of sight can in principle be empirically constrained from high angular resolution optical observations. Those which are in very optically thick regime need to be fixed from physical considerations, with a posteriori consistency checks with data. Optically thin components are the old stellar populations in the disk or in the bulge. In edge-on galaxies Xilouris et al. (1998) has shown that in the optical and NIR bands one can derive the scalelength and scaleheights of the disk stellar populations and associated dust, as well as the effective radius of the bulge stellar populations by fitting observed images with simulated images produced from radiative transfer calculations.
The geometry of young stellar populations and associated dust cannot be constrained directly from observations of direct stellar light, because young stars are highly obscured in most cases. From physical considerations we know that young stellar populations are born out of molecular clouds and therefore initially have small velocity dispersions and small scaleheights. Furthermore we expect a strong spatial correlation between the young stars and the dust associated with the parent molecular clouds. This situation has been modeled by Popescu et al. (2000b) by distributing the stellar population in a thin exponential disk and the associated dust in a second layer which is also thin (small scaleheight) and occupies the same volume of space as the young stellar population.
Apart from specifying the geometry on kpc scales, an SED model needs to also take into account the absorption of radiation on pc scales, which arises from dust in the birth-clouds of massive stars. Because these clouds are spatially correlated with their progeny on parsec scales, they are illuminated by a strong UV-dominated radiation field of intensity 10-100 times that in the diffuse ISM. This gives rise to a localised component of emission from grains in thermal equilibrium with these intense radiation fields, which needs to be properly modeled. In principle one would then need to design a radiative transfer code that could operate from kpc down to pc scales. To date, the best resolution achieved with an adaptive grid code when modelling the observed SED of an individual galaxy is only 20 pc (Bianchi (2008)), much coarser than the required pc resolution.
For spiral galaxies we can circumvent this problem by making the
assumption that the heating of the grains in the birth clouds is
dominated by photons from their stellar progeny, and by neglecting any
external contribution from the diffuse ambient radiation fields in the
modelled galaxy. This should be an excellent approximation for spiral
galaxies, where the filling factor of star-formation regions is
small. In this case we can perform the radiative transfer calculations
only for the diffuse component, and assume that a fraction 1-F of
the radiation coming from the young stars in the birth clouds will
escape their clouds and propagate in the diffuse component, but
essentially no photon from the diffuse component will be absorbed by and
heat the dust inside the clouds. This concept was introduced by the
models of
Silva et
al. (1998)
and
Popescu et al. (2000b).
The low filling factor of opaque clouds in
spiral disks assumed by this technique is supported by high resolution
surveys of the Galactic Plane, e.g. the APEX Telescope Large Area
Survey (ATLAS) of the Galaxy at 870 µm
(Schuller et al. (2009)).
One should mention here that ATLAS is a very sensitive survey, going
down to 50 mJy/beam, which is close to the
 = 1 limit in the V band,
thus ensuring that any optically thick cloud would be detected in this
survey. By contrast, the distribution of the CO line shows a more
diffuse distribution (see
Matsunaga et al. (2001)),
with large clouds overlapping and a very high
filling factor. This is because the
12C16O line traces the optically
thin outer surfaces of the molecular clouds, which is a different volume
of space than that traced by the 870 µm emission. We therefore
caution modellers of the SEDs of spiral galaxies not to follow the
distribution of the CO emission when tracing the distribution of dust
clumps which are optically thick in the UV/optical.
= 1 limit in the V band,
thus ensuring that any optically thick cloud would be detected in this
survey. By contrast, the distribution of the CO line shows a more
diffuse distribution (see
Matsunaga et al. (2001)),
with large clouds overlapping and a very high
filling factor. This is because the
12C16O line traces the optically
thin outer surfaces of the molecular clouds, which is a different volume
of space than that traced by the 870 µm emission. We therefore
caution modellers of the SEDs of spiral galaxies not to follow the
distribution of the CO emission when tracing the distribution of dust
clumps which are optically thick in the UV/optical.
For starburst galaxies the approximation of a small filling factor for the star-formation regions is obviously no longer valid, and other procedures need to be invoked when modelling this type of galaxies. One way is to consider these galaxies as a collection of HII regions, as modelled by Dopita et al. (2005) with the updates from [Groves et al. (2008)]. These models have a physical description for the evolution of the star-forming complexes and they also take into account collective effects due to merging of HII regions. However they still do not consider heating of the clumps by the external ambient radiation fields and do not have a diffuse component to contribute to the FIR emission. Another model proposed for starbursts is the hot spot model of Siebenmorgen & Krugel (2007). This model considers star-forming clouds embedded in a diffuse radiation field, all within spherical symmetry, which is a reasonable assumption for starbursts. They also consider the heating of the clumps by the external radiation field, but this is not done in a self-consistent way.
Having specified the geometry of the problem the next step in any SED model is to run radiative transfer calculations (see Kylafis & Xilouris (2005) for a comprehensive review on radiative transfer techniques) to derive the radiation fields in galaxies. Fig. 3 (left panel) shows an example of calculated radial profiles in the plane of a typical spiral galaxy having a bulge-to-disk ratio B / D = 0.33. We note here the large variation in the colour of the radiation fields with position, which will introduce large differences in the shape of the FIR SEDs, as well as in the predictions about the role different stellar populations have in heating the dust as a function of position in the galaxy. Finally this will strongly affect the conclusions about the SFR and SF efficiencies in galaxies. Thus, models that assume radiation fields with the fixed colour of the local interstellar radiation fields (LIRF) are likely to introduce systematic uncertainties in the predictions for the dust emission SEDs and therefore for the conversion of gas into stars as a function of galactocentric radius.
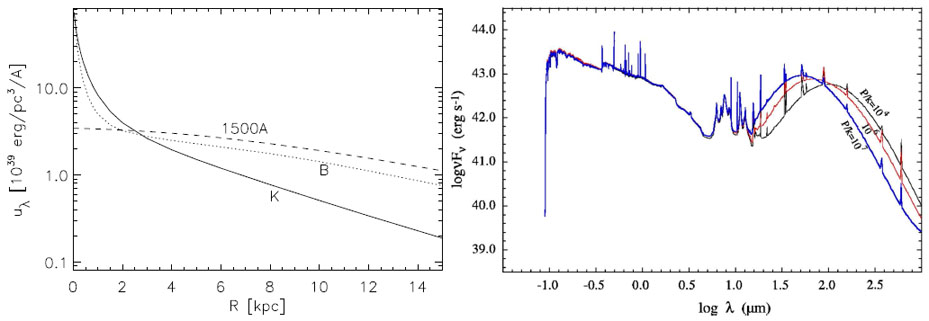 |
Figure 3. Left: Example of radial profiles of radiation fields (calculated using the model of Popescu et al. (2000b)) in the plane of a typical spiral galaxy having a bulge-to-disk ratio B / D = 0.33. Right: Predicted SEDs for different pressure of the ambient interstellar medium, from Dopita et al. (2005). |
Once radiation fields in galaxies are calculated one can derive the temperature distribution of grains of different sizes and composition as a function of position in the galaxy. Here it is important to recall that most of the grains in the interstellar medium are not heated in equilibrium with the radiation fields, but are heated stochastically. Fig. 4 shows examples of calculated probability distributions of temperature for grains of different sizes, composition and at different positions in a galaxy. The same grain sizes are plotted for each position and the calculation corresponds to a typical spiral galaxy having a B / D = 0.33. Overall small grains are more stochastically heated and therefore exhibit large temperature fluctuations while big grains emit at equilibrium temperature and therefore exhibit distributions close to or delta functions. Apart from the dependence on grain size, the temperature distributions also strongly depend on the intensity and colour of the radiation fields. One can see from Fig. 4 that big grains placed in the centre of the galaxy, where radiation fields are stronger and redder will emit close to equilibrium temperature, while the same grains placed in the weaker and bluer radiation fields in the outskirts of the galaxy will exhibit temperature fluctuations. This emphasises the need to have a self-consistent calculation, where the color and intensity of the radiation fields are calculated as a function of position in the galaxy.
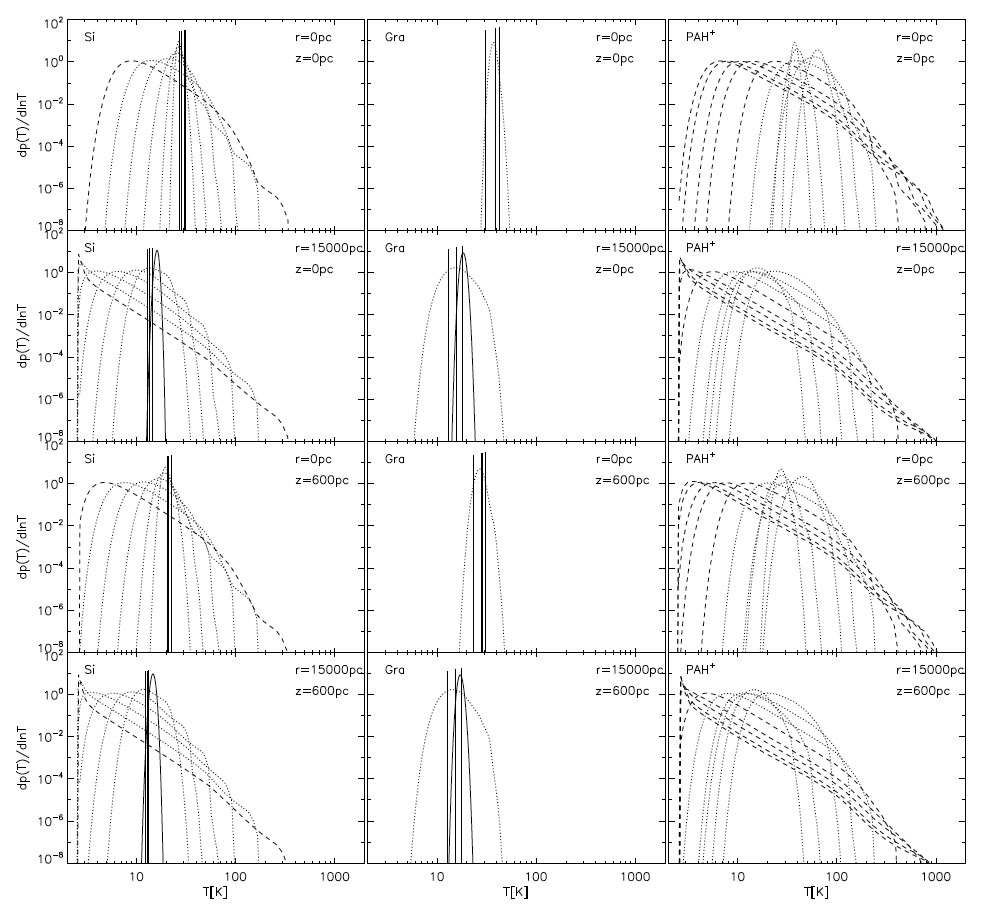 |
Figure 4. Temperature distributions for
dust grains of different sizes (plotted
as different curves in each panel) and various composition: Si (left
panels), Gra (middle panels) and PAH+ (right panels), heated
by the diffuse radiation fields. The calculations were done for a
typical spiral galaxy having a bulge-to-disk ratio B / D
= 0.33 and using the model of
Popescu et al. (2000b).
Temperature distributions for PAH0 are
not plotted in this figure. Dashed lines are for grains with radius
a < 0.001 µm (0.00035, 0.00040, 0.00050, 0.00063 and
0.00100 µm), dotted lines are for grains with
0.001 < a |
The spatially integrated dust and PAH SEDs can then be obtained by
integrating over all positions in a galaxy. We first show the
predictions for the diffuse component in spiral galaxies, using the
model of
Popescu et al. (2000b),
where the parameters of interest are: dust opacity
(Bf),
luminosity of the
young stellar populations (SFR), luminosity of the old disk
stellar populations (old) and B / D.
Fig. 5
shows SEDs where one parameter at a time is varied, all the others being
fixed to the values corresponding to the best fit of NGC 891. The
main effect of increasing opacity is to increase the overall amplitude
of the dust and PAH emission SEDs, with a fast increase for the
optically thin cases and a slower increase and eventually a saturation
for the optically thick cases. We note here that the opacity is the only
parameter that changes the submm level. Essentially one cannot increase
the level of submm emission by just increasing the luminosity of the
heating sources. The effect of increasing the SFR is to produce
warmer SEDs, both because the peak of the SEDs shifts towards shorter
wavelengths, but also because the ratio between mid-infrared (MIR) and
FIR increases. An increase in the contribution of the old disk stellar
population old produces a similar shift of the peak of the FIR
SEDs towards shorter wavelengths, but the amplitude of the MIR/PAH
emission does not increase accordingly, as the PAH are mainly excited by
the UV photons predominantly produced by the young stellar
population. The variation in the B / D produces very similar
changes in the IR SEDs to those produced by the variation in the disk
old stellar populations, but with a small dynamic range. Overall the
ratio between the PAH and FIR emission will be highly dependent on the
ratio of the old to young stellar populations.
From the trends in Fig. 5 one can see that overall the 4 parameters of the model are fairly orthogonal and it is therefore possible to decode the FIR SEDs in a fairly non-degenerate way. Of course one would need to add the clumpy component to the diffuse one to obtain the total infrared SEDs, and this would add another parameter (F - the clumpiness factor in the model of Popescu et al. (2000b)). However, the optical and UV data need also to be added when trying to decode the panchromatic SEDs. Thus, the corresponding predictions for attenuation of stellar light (Tuffs et al. (2004), but see also Pierini et a. (2006) for alternative models) should be used in conjunction with the dust emission SEDs in order to obtain final solutions. The derived values of opacity can then be used to correct surface-brightness (SB) photometry of stellar light for the effect of dust using corresponding models (see Möllenhoff et al. (2006)). Alternative methods for obtaining dust opacities rely on statistical determinations (e.g. Driver et al. (2007)); see Graham & Worley (2008) for studies of dust corrected SB photometric parameters.
 |
Figure 5. Spatially integrated dust and PAH emission SEDs of the diffuse component calculated using the model of Popescu et al. (2000b). Each panel shows the effect of changing one parameter of the model at a time, while the other parameters are kept fixed to the value corresponding to the best fit of NGC 891. |
Lets now consider the total IR emission from starburst galaxies. In the model of Dopita et al. (2005) (see also Groves et al. (2008)) the infrared emission is taken to be exclusively emitted by dust in PDR regions at the interface of HII regions with their parent molecular clouds. The main factor controlling the shape of the dust emission SED is then the radius of the PDRs, which is larger for lower density, low pressure environments, and smaller for high density, high pressure environments. In Fig. 3 (right panel) one sees the effect of changing ambient pressure from P / k = 104 cm-3 K (ambient medium of a spiral galaxy) to 106 through 107 cm-3 K (ambient medium of a starburst). The PDR is closer to the exciting stars for the higher pressure environment and thus the dust emission is warmer for this case.
In the model of Siebenmorgen & Krugel (2007), the IR emission is emitted by a combination of clouds with embedded stars and a diffuse dusty intercloud medium. Thus, the temperature of the dust emission depends not only on the compactness of the clouds, but also on the opacity of the diffuse intercloud medium and the overall luminosity density of the stars. Siebenmorgen & Krugel (2007) showed the effect of increasing the illumination of dust in the diffuse medium by either increasing the number of stars or by decreasing the radius of the starburst region or by decreasing the opacity of the diffuse medium. By contrast, the effect of changing the size of the clumps (done in this model by a density parameter), was found to be quite small.
In conclusion, different models invoke different physical mechanisms to change the illumination of grains in starburst galaxies. The main difference relates to the relative importance of the clumps and diffuse interclump medium, and better observational constraints are needed to pin down this issue.
3.2. Encoding predicted physical quantities
As mentioned before, the second approach to modelling the SEDs of galaxies is that of encoding predicted physical quantities. In most cases this entails using simulated images of galaxies as input for dusty radiative transfer codes to predict the appearance of these images as would be seen through dust and also to predict the dust emission images - see Jonsson et al. (2009), Chakrabarti et al. (2008). For example Jonsson et al. (2009) uses the same approximation for the treatment of the clumpy component as that used in the models that decode the observed SEDs of spiral galaxies (see Silva et al. (1998) and Popescu et al. (2000b)). Thus, Jonsson et al. (2009) makes the assumption that the illumination of the birth clouds is dominated by emission coming from the embedded stars, and considers the radiative transfer only for the diffuse component, while the clumpy component is treated separately, using the model of Groves et al. (2008). So in this way the local absorption on pc scales is dealt with.
In this approach the geometry does not need to be specified, since it is provided by the simulations. The use of simulations has the advantage to provide quite spectacular images of galaxies (see Fig. 6). However, because of the high resolution required to produce all the structure provided by the simulations, explicit calculation of the radiation fields is not performed, as this would add an extra dimension to the overall calculation, and make them intractable. Since radiation fields are not calculated, self-consistent calculations of the stochastic heating of the small grains and PAH molecules cannot be performed. In the model of Jonsson et al. (2009) the phenomenological model of Draine & Li (2007) is used instead to re-radiate the emission from stochastically heated grains.
 |
Figure 6. Simulated images of a dust attenuated galaxy seen at different inclinations, from [Jonsson et al. (2009)]. |
Here we have attempted to give a broad classification of the different approaches to the SED modelling of galaxies. It was our intention to introduce general concepts rather than cover detailed models in the literature. A more complete list of SED models also includes: Siebenmorgen & Krugel (1992), Rowan-Robinson & Efstathiou (1993), Krugel & Siebenmorgen (1994), Efstathiou et al. (2000), Bianchi et al. (2000), Efstathiou & Rowan-Robinson (2003), Galliano et al. (2003), Takagi et al. (2003), Misiriotis et al. (2004), Baes et al. (2005), Takeuchi et al. (2005), Misselt et al. (2001), Piovan et al. (2006), where here we did not include models for AGN tori.
 0.01
(0.00158, 0.00251, 0.00398, 0.00631, 0.01000μm) and solid lines are
for grains with a > 0.01 (0.0316, 0.10000, 0.31623, 0.7943
µm). The
biggest grains have delta function distributions, since they emit at
equilibrium temperature. Going from the top to the bottom panels the
calculations are done for different positions in the model galaxy:
r = 0 pc, z = 0 pc; r = 15000 pc, z = 0 pc;
r = 0 pc, z = 600 pc; and
r = 15000 pc, z = 600 pc.
0.01
(0.00158, 0.00251, 0.00398, 0.00631, 0.01000μm) and solid lines are
for grains with a > 0.01 (0.0316, 0.10000, 0.31623, 0.7943
µm). The
biggest grains have delta function distributions, since they emit at
equilibrium temperature. Going from the top to the bottom panels the
calculations are done for different positions in the model galaxy:
r = 0 pc, z = 0 pc; r = 15000 pc, z = 0 pc;
r = 0 pc, z = 600 pc; and
r = 15000 pc, z = 600 pc.