


Processes operating during cluster formation and evolution discussed in the previous section are complex and nonlinear. However, it is now also clear that most of the complexity is confined to cluster cores and affects a small fraction of volume and mass of the clusters. In this regime, clusters' observational properties exhibit strong deviations from the self-similar scalings described in Section 3.9 (see also Voit 2005). At larger radii, ICM is remarkably regular. In this section, we discuss the origins of such highly regular behaviour and the range of radii where it can be expected. We argue that the existence of this radial range allows us to define integral observational quantities, which have low scatter for clusters of a given mass that are not sensitive to the astrophysical processes operating during cluster formation and evolution. This fact is especially important for the current and future uses of clusters as cosmological probes (Allen, Evrard & Mantz 2011, Weinberg et al. 2012).
4.1. Characterizing regularity
A number of observational evidences, based on X-ray measurements of
gas density (e.g.
Croston et
al. 2008)
and temperature profiles
(Vikhlinin
et al. 2006,
Pratt et
al. 2007,
Leccardi
& Molendi 2008),
and the combination of the two in the form of entropy profile
(Cavagnolo
et al. 2009),
demonstrate that clusters have a variety of
behaviors in central regions, depending on the presence and prominence
of cool cores. As discussed in Section 2,
outside of
core regions, clusters behave as a more homogeneous population and
obey assumptions and expectations of the self-similar model
(discussed above in 3.9.1). For
instance, Figure 3 shows that the
ICM density is nearly independent of
temperature once measured outside of core regions r
 r2500,
at least for relatively hot systems with T
3 keV. Quite
remarkably, observed and simulated temperature profiles agree with
each other within this same radial range (see
Figure 4).
r2500,
at least for relatively hot systems with T
3 keV. Quite
remarkably, observed and simulated temperature profiles agree with
each other within this same radial range (see
Figure 4).
A good illustration of the regularity of the ICM properties is
represented by the pressure profiles shown in
Figure 13 (from
Arnaud et
al. 2010,
but see also
Sun et al. 2011)
rescaled to the values of radius and pressure at
r500. The perfectly regular, self-similar behavior would
correspond to a single line in this plot for clusters of all
masses. The pressure profiles shown in this figure are derived from
X-ray observations and are defined as the product of electron number
density and temperature profiles. Similar profiles are now derived
from SZ observations, which probe pressure more directly (e.g.,
Bonamente
et al. 2012).
Quite remarkably, the observed pressure profiles at r
0.2r500 follow a nearly universal profile (see also
Nagai,
Kravtsov & Vikhlinin 2007),
exhibiting fractional scatter of
 30% at r ~
0.2r500 and even smaller
scatter of ~ 10-15% at r ~ 0.5r500. At
smaller radii the
scatter of pressure profiles is much larger, with steep profiles
corresponding to the cool core clusters and flatter profiles for
disturbed clusters. Figure 13
shows that simulated and observed pressure profiles agree well with each
other for r
0.2r500, i.e., in the regime where the cluster
population has a more regular behaviour. At smaller radii the profiles
from simulations are on average steeper than observed, and exhibit a
lower degree of diversity between cool core and non-cool core clusters.
30% at r ~
0.2r500 and even smaller
scatter of ~ 10-15% at r ~ 0.5r500. At
smaller radii the
scatter of pressure profiles is much larger, with steep profiles
corresponding to the cool core clusters and flatter profiles for
disturbed clusters. Figure 13
shows that simulated and observed pressure profiles agree well with each
other for r
0.2r500, i.e., in the regime where the cluster
population has a more regular behaviour. At smaller radii the profiles
from simulations are on average steeper than observed, and exhibit a
lower degree of diversity between cool core and non-cool core clusters.
The scatter in the cluster radial profiles can be used to define the following three radial regimes.
r2500, which exhibit the
largest scatter and where scaling with mass differs significantly
from the self-similar scaling expectation. We do not yet have a
complete and adequate theoretical understanding of the observed
properties of the ICM and their diversity in the cluster cores. This
is one of the areas of active ongoing theoretical and observational
research.
r
r500,
which exhibit the smallest scatter and scaling with mass close to
the self-similar scaling. Although the processes affecting
thermodynamics of these regions are not yet fully understood, the
simple scaling and regular behavior make observable properties of
clusters at these radii useful for connecting them to the total
cluster mass.
The physical origin of the regular scaling with mass is the fact that cluster mass is the key control variable of cluster formation, which sets the amount of gas mass, the average temperature of the ICM, etc. It is important to note that the close to self-similar scaling with mass outside the cluster core does not imply that the non-gravitational physical processes are negligible in this regime. For instance, Sun et al. (2009) showed that entropy measured at r500 has a scaling with temperature quite close to the self-similar prediction, yet its level is higher than expected from a simple model in which only gravity determines the evolution of the intra-cluster baryons. This implies that whatever mechanism one invokes to account for such an entropy excess, it must operate in such a way as to not violate the self-similar scaling. The scatter around the mean profile exhibited by clusters at different radii can be due to a number of factors. In particular, the small scatter at intermediate radii is a non-trivial fact, given that different clusters of the same mass are in different stages of their dynamical evolution and physical processes affecting their profiles may have operated differently due to different formation histories.
 |
Figure 13. Comparison between observed (black lines) and simulated (red lines with orange shaded area) pressure profiles (from Arnaud et al. 2010). Observational data refer to the Rrepresentative XMM-Newton Cluster Structure Survey (REXCESS) sample of nearby clusters (Böhringer et al. 2007) observed with XMM-Newton. Simulation results are obtained by combining different sets of clusters simulated with both smoothed particle hydrodynamics and adaptive mesh refinement codes (see Arnaud et al. 2010 for details). The continuous red line corresponds to the average profile from simulations, after rescaling profiles according to the values of R500 and M500 predicted by hydrostatic equilibrium, with the orange area showing the corresponding rms scatter. The red dotted line shows the simulation results when using instead the true M500 value. The bottom panel shows the ratio between average simulation profiles and average observed profiles. |
One of the interesting implications of the small scatter in the pressure profiles is that it provides an upper limit on the contribution of non-thermal pressure support or, at least, on its cluster-by-cluster variation. A well-known source of non-thermal pressure is represented by residual gas motions induced by mergers, galaxy motions, and gas inflow along large-scale filaments. Cosmological hydrodynamical simulations of cluster formation have been extensively used to quantify the pressure support contributed by gas motions and the corresponding level of violation of HE (e.g., Rasia, Tormen & Moscardini 2004, Nagai, Kravtsov & Vikhlinin 2007, Ameglio et al. 2009, Piffaretti & Valdarnini 2008, Lau, Kravtsov & Nagai 2009, Biffi, Dolag & Böhringer 2011). All these analyses consistently found that ICM velocity fields contribute a pressure support of about 5% to 15% per cent of the thermal one, the exact amount depending on the radial range considered (being larger at larger radii) and on the dynamical state of the clusters. Currently, there are only indirect indications for turbulent motions in the ICM of the real clusters from fluctuations of gas density measured in X-ray observations (e.g., Schuecker et al. 2004, Churazov et al. 2012). Direct measurements or upper limits on gas velocities and characterization of their statistical properties should be feasible with future high-resolution spectroscopic and polarimetric instruments on the next-generation X-ray telescopes (e.g., Inogamov & Sunyaev 2003, Zhuravleva et al. 2010).
The galaxies and groups orbiting or infalling onto clusters not only stir the gas, but also make the ICM clumpier. The dense inner regions of clusters ram-pressure strip the gas on a fairly short time scale, so that the clumping is fairly small near cluster cores. However, it is substantial in the outskirts in cluster simulations where orbital times are longer and accretion of new galaxies and groups is ongoing. Given that the X-ray emissivity scales as the square of the local gas density, the clumpiness can bias the measurement of gas density from X-ray surface brightness profiles toward higher values if it is not accounted for. Because clumping is expected to increase with increasing cluster-centric radius, the inferred slope of gas density profiles can be underestimated, thus affecting the resulting pressure profile and hydrostatic mass estimates. Furthermore, gas clumping also affects X-ray temperature which is measured by fitting the X-ray spectrum to a single-temperature plasma model (Mazzotta et al. 2004, Vikhlinin 2006). Clumping can therefore contribute to the scatter of pressure profiles at large radii, especially at r > r500 (e.g., Nagai & Lau 2011).
Indirect detections of gas clumping through X-ray observations out to r200 have been recently claimed, based on Suzaku observations of a flattening in the X-ray surface brightness profiles at such large radii (Simionescu et al. 2011). However, these results are prone to significant systematic uncertainties (Ettori & Molendi 2011). Independent analyses based on the ROSAT data (e.g. Eckert et al. 2011) show the surface brightness profiles steepens beyond r500 (see also Vikhlinin, Forman & Jones 1999, Neumann 2005), which is inconsistent with the degree of gas clumping inferred from the Suzaku data, but consistent with predictions of hydrodynamical simulations.
Clearly, the clumpiness of the ICM depends on a number of uncertain physical processes, such as efficient feedback, which removes gas from merging structures, or thermal conduction, which homogenizes the ICM temperatures (e.g., Dolag et al. 2004). The degree of gas clumping in density and temperature is therefore currently uncertain in both theoretical models and observations. Future high-sensitivity SZ observations of galaxy clusters with improved angular resolution will allow a direct measurement of projected pressure profiles. Their comparison with X-ray derived profiles will help in understanding the impact of gas clumping on the thermal complexity of the ICM.
Additional non-thermal pressure support can be provided by the
magnetic fields and relativistic cosmic rays, the presence of which in
the ICM is demonstrated by radio observations of the radio halos:
diffuse and faint radio sources filling the central Mpc3
region of many galaxy clusters (e.g.,
Giovannini
et al. 2009,
Venturi et
al. 2008)
arising due to the synchrotron emission of highly relativistic
electrons moving in the ICM magnetic fields. The origin of these
relativistic particles still needs to be understood, although several
models have been proposed. Shocks and turbulence associated with
merger events are expected to compress and amplify magnetic fields and
accelerate relativistic electrons (see, e.g.,
Ferrari et
al. 2008
and
Dolag, Bykov
& Diaferio 2008
for reviews). Numerical simulations including injection of cosmic rays
from accretion shocks and SN explosions (e.g.,
Pfrommer et
al. 2007,
Vazza et
al. 2012)
indicate that
cosmic rays contribute a pressure support, which can be as high as ~
10% for relaxed clusters and ~ 20% for unrelaxed clusters at
the outskirts. At smaller radii, the pressure contribution of cosmic
rays in these models becomes small
( 3% at r
.1rvir), which is consistent with the upper limits
from  -ray
observations by the Fermi Gamma-ray Telescope (e.g.,
Ackermann
et al. 2010).
-ray
observations by the Fermi Gamma-ray Telescope (e.g.,
Ackermann
et al. 2010).
The role of intracluster magnetic fields have been investigated in a
number of studies using cosmological simulations (see
Dolag, Bykov
& Diaferio 2008
for a review). The general result is that pressure support
from magnetic fields should be limited to
5%, which is
consistent with observational constraints on the magnetic field
strength ( ~ µ G) (e.g.,
Vogt &
Enßlin 2005,
Govoni et
al. 2010)
and upper limits on the contribution of magnetic fields to non-thermal
pressure support (e.g.
Laganá, de
Souza & Keller 2010).
As a summary, the scatter in cluster profiles in the cluster cores is mainly driven by differences in the physical processes such as cooling and heating by AGN feedback and different merger activity that different clusters experienced during their evolution. At intermediate radii, the scatter is small because the ICM is generally in good HE within cluster gravitational potential and because processes that shaped its thermodynamic processes have not introduced new mass scale so that self-similar scaling is not broken. In the cluster outskirts, the scatter is expected to be driven by deviations from HE and other sources of non-thermal pressure support such as the cosmic rays, as well as by a rapid increase of ICM clumpiness with increasing radius.
Existence of the radial range, where ICM properties scale with mass similarly to the self-similar expectation with a small scatter, implies that we can define integral observable quantities within this range that will obey tight scaling relations among themselves and with the total cluster mass. Furthermore, these scaling relations are also expected to be weakly sensitive to the cluster dynamical state, given that relaxed and unrelaxed clusters have similar profiles at these intermediate radii. Indeed, as we showed in Section 2 (see Fig. 5), X-ray luminosity measured within the radial range [0.15-1]r500 exhibits a tight scaling against the total ICM thermal content measured by the YX parameter, with relaxed and unrelaxed clusters following the same relation. Here YX is defined as the product of gas mass and X-ray temperature, both measured within r500 but like LX temperature is measured after excising the contribution from r < 0.15r500.
As discussed in Section 3.9, the gas
temperature T, gas
mass Mgas and total thermal content of the ICM
Y = MgasT, are commonly used examples of
integral observational
quantities whose scaling relations with cluster mass are predicted by
the self-similar model and for which calibrations based on X-ray and
SZ observations (or their combinations) and simulations are available.
For example, Figure 14 shows the scaling relation
between YX, and M500 for simulated
clusters and for a set of
clusters with detailed Chandra observations from a study by
Kravtsov,
Vikhlinin & Nagai (2006),
where YX was introduced and defined
specifically to use the temperature estimated only at
0.15r500 < r < r500 in
order to minimize the scatter. The relation
of YX with M500 in simulations has
scatter of only
 8% when both relaxed
and unrelaxed clusters are included
and evolution of its normalization with redshift is consistent with
expectations of the self-similar model. The insensitivity of the
relation the dynamical state of clusters is not trivial and is due to
the fact that during mergers clusters move almost exactly along the
relation (e.g.,
Poole et
al. 2007,
Rasia et
al. 2011).
In addition, the slope and normalization of the YX -
M500 relation is also
not sensitive to specific assumptions in modelling cooling and
feedback heating processes in simulations
(Stanek et
al. 2010,
Fabjan et
al. 2011),
which makes them more robust theoretically.
8% when both relaxed
and unrelaxed clusters are included
and evolution of its normalization with redshift is consistent with
expectations of the self-similar model. The insensitivity of the
relation the dynamical state of clusters is not trivial and is due to
the fact that during mergers clusters move almost exactly along the
relation (e.g.,
Poole et
al. 2007,
Rasia et
al. 2011).
In addition, the slope and normalization of the YX -
M500 relation is also
not sensitive to specific assumptions in modelling cooling and
feedback heating processes in simulations
(Stanek et
al. 2010,
Fabjan et
al. 2011),
which makes them more robust theoretically.
The YSZ - M relation also exhibits a comparably low-scatter and the slope and evolution of normalization are close to the predictions of the self-similar model (da Silva et al. 2004, Motl et al. 2005), which is not surprising given the similarity between the YX and the integrated YSZ measured from SZ observations. Its normalization changes by up to 30-40% depending on the interplay between radiative cooling and feedback processes included in the simulations (e.g. Nagai 2006, Bonaldi et al. 2007, Battaglia et al. 2011 and references therein). At the same time, simulation analysis is also shedding light on the effect of projection (e.g. Kay et al. 2012) and mergers (e.g. Krause et al. 2012) on the scatter in the YSZ - M scaling.
The tight relation of integral quantities such as YX, YSZ, Mg, or core-excised X-ray luminosity with the total mass makes them good proxies for observational estimates of cluster mass, which can be used at high redshifts even with a relatively small number of X-ray photons. For instance, integral measurements of gas mass or temperature requires ~ 103 photons, which is feasible for statistically complete cluster samples out to z ~ 1 (e.g., Maughan 2007, Vikhlinin et al. 2009a, Mantz et al. 2010a) or even beyond. This makes these integral quantities very useful as "mass proxies" in cosmological analyses of cluster populations (e.g., Allen, Evrard & Mantz 2011). Clearly, the relation of such mass proxies with the actual mass needs to be calibrated both via detailed observations of small controlled cluster samples and in cosmological simulations of cluster formation.
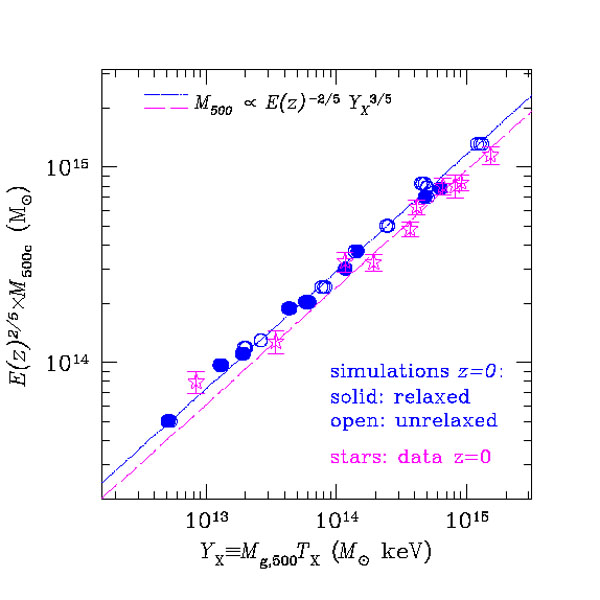 |
Figure 14. The YX - M500 relation for a set of simulated clusters at z = 0 (circles) and for a sample of relaxed Chandra clusters from Vikhlinin et al. (2006) (stars with errorbars). Filled and open circles refer to simulated clusters which are classified as relaxed and unrelaxed, respectively. Core regions inside 0.15r500 are excised in the measurement of the X-ray temperature entering into the computation of YX, for both simulated and real clusters. True and hydrostatic masses are shown for simulated and observed clusters, respectively. The dot-dashed line shows the best-fit power-law relation for the simulated clusters with the slope fixed to the self-similar value of alpha = 3/5. The dashed line shows the same best-fit power-law relation to simulations, but with the normalization scaled down by 15%, which takes into account the putative effect of hydrostatic mass bias due to residual gas motions. From Kravtsov, Vikhlinin & Nagai (2006). |
The potential danger of relying on simulations for this calibration is that results could be sensitive to the details of the physical processes included. This implies that a mass proxy is required to have not only a low scatter in its scaling with mass, but also to be robust against changing the uncertain description of the ICM physics. As we noted above, YX is quite robust to changes within a wide range of assumptions about cooling and heating processes affecting the ICM. This is illustrated in Figure 15 (taken from Fabjan et al. 2011) which shows how the normalization and slope of the scaling relation of gas mass and YX versus M500 change with the physical processes included. The evolution of the YX-M500 relation with redshift is also consistent with self-similar expectations for different models of cooling and feedback. Other quantities, such as Mg, often exhibit a similar or even smaller degree of scatter compared to YX but are more sensitive to the choice of physical processes included in simulations. An additional practical consideration is that theoretical models should consider observables derived from mock observations of simulated clusters that take into account instrumental effects of detectors and projection effects (e.g., Rasia et al. 2006, Nagai, Vikhlinin & Kravtsov 2007, Biffi et al. 2011).
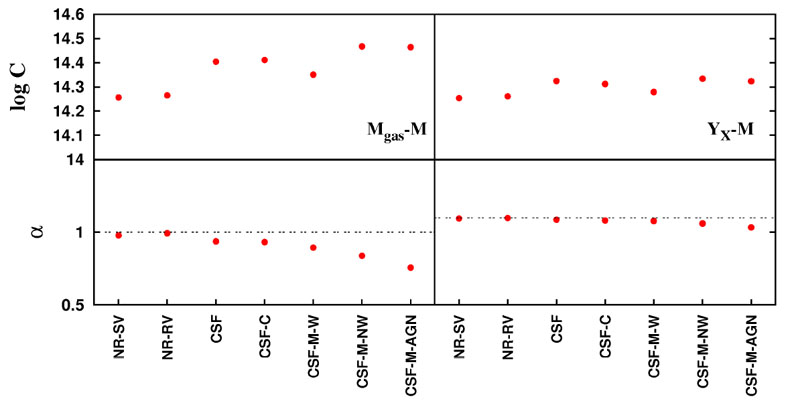 |
Figure 15. Sensitivity of different mass
proxies on the physical
description of the intracluster medium included in cosmological
hydrodynamical simulations for a set of galaxy clusters (from
Fabjan et
al. 2011).
Results for the scaling
relation of M500 with gas mass Mgas
and YX are shown in
the left and right panels, respectively. Best fitting normalization
C and slope |
Ultimately, calibration of mass proxies for precision use should be obtained via independent observational mass measurements, using the weak lensing analysis, HE, or velocity dispersions of member galaxies. The combination of future large, wide-area X-ray, SZ, and optical/near-IR surveys should provide a significant progress in this direction.
 of
the scaling relations of these three mass
proxies are shown in the upper and lower panels, respectively. Here,
Tmw is the mass-weighted temperature computed
excluding the central cluster regions within
0.15r500. In the lower panels,
the horizontal dashed lines mark the values of the slope of the
scaling relations predicted by the self-similar model. Results are
shown for simulations only including non-radiative hydrodynamics
with standard (NR-SV) and reduced artical viscosity (NR-RV);
cooling and star formation without (CSF) and with thermal conduction
(CSF-C); cooling and star formation with metal enrichment, with
(CSF-M-W) and without (CSF-M-NW) galactic winds from SN explosions;
and cooling and star formations with the effect of AGN feedback
(CSF-M-AGN) (see
of
the scaling relations of these three mass
proxies are shown in the upper and lower panels, respectively. Here,
Tmw is the mass-weighted temperature computed
excluding the central cluster regions within
0.15r500. In the lower panels,
the horizontal dashed lines mark the values of the slope of the
scaling relations predicted by the self-similar model. Results are
shown for simulations only including non-radiative hydrodynamics
with standard (NR-SV) and reduced artical viscosity (NR-RV);
cooling and star formation without (CSF) and with thermal conduction
(CSF-C); cooling and star formation with metal enrichment, with
(CSF-M-W) and without (CSF-M-NW) galactic winds from SN explosions;
and cooling and star formations with the effect of AGN feedback
(CSF-M-AGN) (see