Copyright © 2012 by Annual Reviews. All rights reserved
| Annu. Rev. Astron. Astrophys. 2012. 50:
491-529 Copyright © 2012 by Annual Reviews. All rights reserved |


This section focuses on the significant observational progress that has
been made in studies of Milky Way halo gas in the past decade (see
Wakker & van
Woerden 1997
for earlier work) and is divided into sub-sections based primarily on
the temperature of the gas. The neutral hydrogen halo gas discussed in
Section 2.1 is at temperatures < 10,000 K and
detected through the 21-cm line in emission. This is traditionally the
primary tracer of Galactic halo gas, and we therefore separately discuss
its physical properties (Section 2.1.1). The warm
and warm-hot gas is defined here as largely ionized with temperatures
> 104 K, but < 106 K
(Section 2.2). This gas is detected in optical line
emission (primarily H )
and absorption lines in the optical and
ultraviolet . Finally, hot gas is at temperatures greater than
106 K and detectable through x-ray observations close to the
disk and indirect methods further out (Section 2.3).
The dust, molecules and metals in halo gas are discussed in
Section 2.4.
)
and absorption lines in the optical and
ultraviolet . Finally, hot gas is at temperatures greater than
106 K and detectable through x-ray observations close to the
disk and indirect methods further out (Section 2.3).
The dust, molecules and metals in halo gas are discussed in
Section 2.4.
Distances are often an issue when defining gas as a halo medium. There has been significant progress in this area (see Section 2.1.1), but in any case, it should be noted that halo gas has largely been defined based on its velocity not falling within the expected Galactic disk velocity in a given direction. This definition may in some (relatively rare) cases pick up Galactic gas that has been recently imparted with a large amount of kinetic energy, and it definitely misses halo gas that overlaps with the velocity of the disk. In general, the transition between halo and disk gas is blurry, and a continuum of gas between the disk and halo seems likely. Halo gas is defined here to be at heights above the Galactic Plane (z-heights) of a few kpc and not part of the Galactic warp, and gas below this that shows some connection to the disk is discussed in the disk-halo interface section (Section 2.5).
2.1. Neutral Hydrogen Halo Gas
The first halo gas detected was in neutral hydrogen emission at high velocity relative to Galactic disk velocities (Muller et al. 1963). These discrete gas clouds were subsequently referred to as high-velocity clouds (HVCs). HVCs are the coldest and densest component of halo gas and are found throughout the sky (Figures 1 & 2). They are material stripped from satellites and/or cooling components of the accreting IGM and feedback material (see Section 4). Significant progress in mapping the distribution of HVCs has come through multibeam instruments that have been used to observe large areas of sky at relatively high resolution (4' to 16'; Putman et al. 2002, Saul et al. 2012, McClure-Griffiths et al. 2009). In addition, the entire sky has now been mapped at a uniform resolution of 35' and 1 km s-1 with the Leiden/Argentine/Bonn (LAB) HI survey (Kalberla et al. 2005; see Figures 1 & 2). The full-sky successor to the LAB survey will be a combination of multibeam surveys with a resolution of 9-16' and 1 km s-1 (McClure-Griffiths et al. 2009, Winkel et al. 2010).
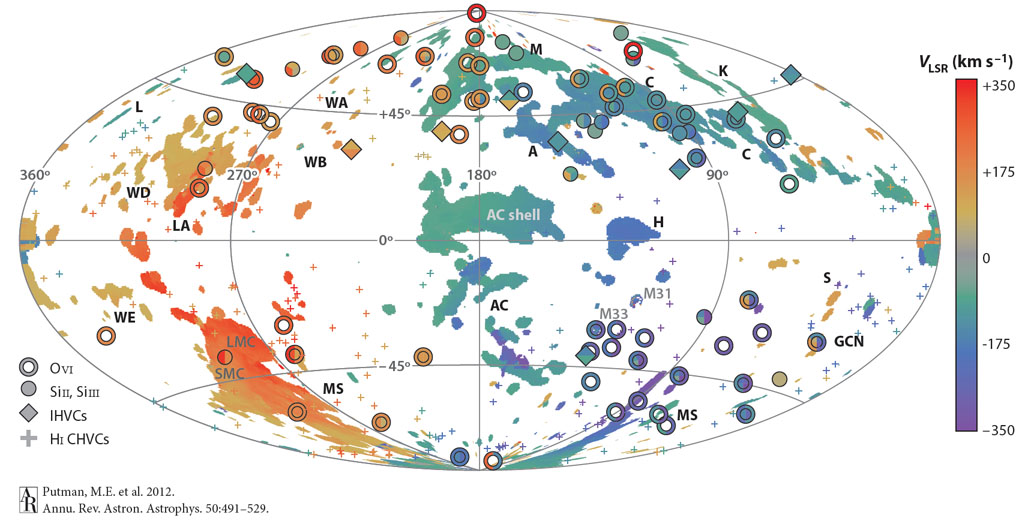 |
Figure 1. The distribution of HI (shaded
clouds and plus symbols) and ionized high velocity gas (circles and
diamonds) on the sky with color denoting the LSR velocity of the
detection. The HI map was created with LAB data by
Westmeier
(2007)
by removing the HI model of the Milky Way from
Kalberla &
Kerp (2009).
The plus symbols represent the the small HI compact HVCs detected with
other datasets
(Putman et
al. 2002,
de Heij et
al. 2002),
open circles are the O VI absorption line detections
(Sembach et
al. 2003),
solid circles are the Si absorption line detections
(Shull et al. 2009),
and diamonds are the ionized HVCs (IHVCs) at
|
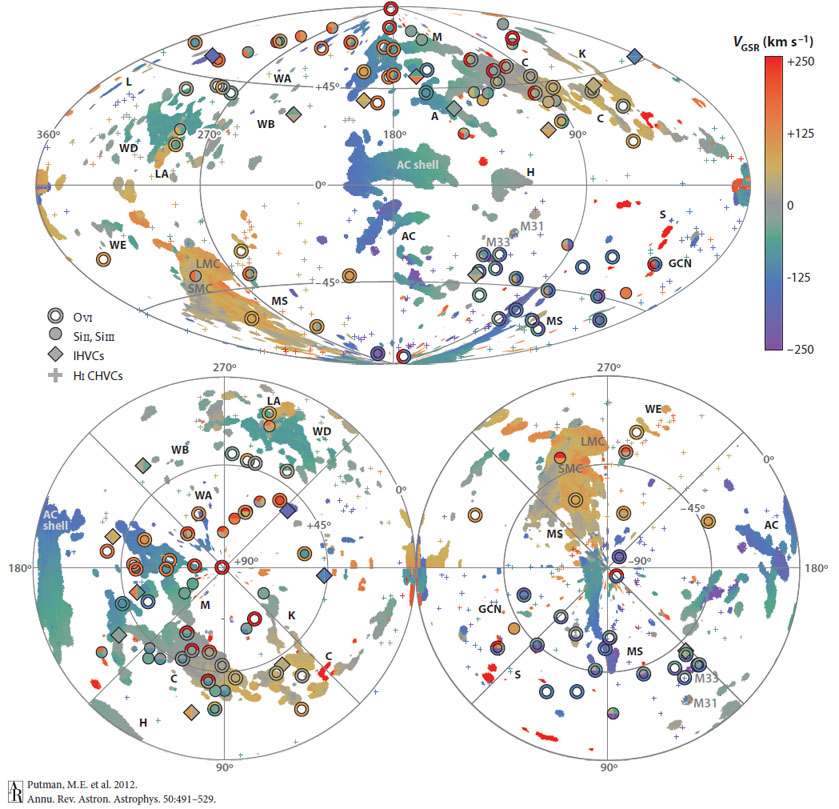 |
Figure 2. The distribution of HI (shaded clouds and plus symbols) and ionized high velocity gas (circles and diamonds) on the sky with color denoting the GSR velocity of the detection. Otherwise this figure is the same as Figure 1, with the exception of showing the view from the North (left) and South (right) Galactic Poles at the bottom. |
HVCs range in size from 1000 deg2 to the resolution limit of the observations, and large clouds are often found to be composed of a number of smaller clouds when observed with better resolution and equivalent sensitivity (Putman et al. 2002, Stanimirovic et al. 2008, Hsu et al. 2011). There are many catalogs of clouds that have been created with the various HI survey data that use different catalog methods. The number of individual clouds in these catalogs ranges from ~ 600 over the entire sky in the lowest resolution surveys (35' beam; Wakker & van Woerden 1991), to 2000 in just the southern sky (15.5' beam; Putman et al. 2002), to ~ 700 clouds smaller than 20' in 7600 deg2 of the sky (4' beam; Saul et al. 2012). It remains difficult to separate the Galactic disk gas from halo gas. One method of cataloguing distinct halo features is to run algorithms on the entire HI data cube to determine structures that are distinct from each other in position-velocity space (Maller et al. in prep.; Sharma & Johnston 2009).
Clouds of all sizes can be grouped into complexes of most likely related
clouds based on their spatial and kinematic proximity as labeled in
Figures 1 and 2. In the
Southern hemisphere the HVCs that dominate in sky coverage and mass are
associated with the Magellanic System. In particular, the complexes
labeled MS and LA are the trailing Magellanic Stream and Leading Arm
(recent references include:
(Putman 2004,
Putman et al. 2003b,
Putman et al. 1998,
Brüns et
al. 2005,
Westmeier &
Koribalski 2008,
Stanimirovic
et al. 2002,
Stanimirovic
et al. 2008,
Nidever et
al. 2010).
These complexes were created from the interaction of the
Large and Small Magellanic Clouds (LMC and SMC) with each other and with the Milky
Way. The Magellanic Stream is a long, continuous structure with a
well-defined velocity and column density gradient, while the Leading Arm
is a collection of clouds throughout the region leading the Magellanic
Clouds. In the Northern hemisphere there are a number of complexes of
similar spatial size, but Complex C is the largest. The best way to view
the HI component of the complexes at their approximate distances (see
2.1.1) is through the three-dimensional
Figure 3. In both hemispheres there are a number
of small clouds called compact HVCs (CHVCs) that have been claimed to be
at large distance due to their size (< 2° in
diameter) and relative isolation
(Braun & Burton
1999,
de Heij et
al. 2002).
CHVCs can largely be associated with known HVC complexes in
position-velocity space as shown by the plus symbols in
Figures 1 and 2, and are
therefore unlikely to be at greater distance. Even the ultra-compact
HVCs ( 20') have
been shown to be related to HVC complexes
(Saul et al. 2012).
None of the CHVCs or HVC complexes have a clear association with stellar
features in the halo
(Hopp et al. 2007,
Siegel et al. 2005),
excluding the association of MS and LA to the Magellanic Clouds.
20') have
been shown to be related to HVC complexes
(Saul et al. 2012).
None of the CHVCs or HVC complexes have a clear association with stellar
features in the halo
(Hopp et al. 2007,
Siegel et al. 2005),
excluding the association of MS and LA to the Magellanic Clouds.
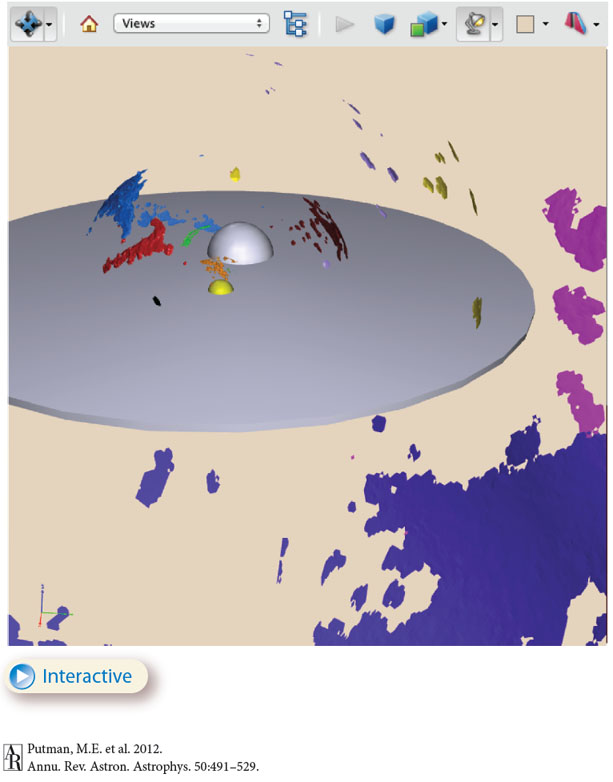 |
Figure 3. 3D, interactive model of the Galactic HVC complexes. The Galactic disk is shown with a 25 kpc radius and a 1 kpc thickness. The central regions of our Galaxy are indicated with a gray 3 kpc radius sphere, and the Solar position is shown with a yellow sphere. HVC complexes are placed at the average of their most stringent distance constraints (Section 2.1.1). The Magellanic Stream is shown starting at a distance of 50 kpc, and increasing linearly to 150 kpc at a Magellanic longitude of 150 degrees, consistent with the models of Besla et al. (2010). The positions of the LMC and SMC are noted with gray spheres. Cloud thickness is an arbitrary function of column density along the line of sight. If the Figure does not appear interactive, please view with a current version of Adobe Reader and click and drag to rotate. |
The majority of the kinematic range of the HVCs can be seen in Figures 1 and 2. The range has been extended further with new surveys and is currently approximately -500 to +450 km s-1 in the Local Standard of Rest velocity frame (VLSR) or between -300 and +300 km s-1 in the Galactic Standard of Rest frame (VGSR). HVCs can be defined by the cloud's deviation velocity (Vdev), or the amount the velocity of the cloud deviates from a simple model of Galactic rotation. Figures 1 and 2 were created with |Vdev| > 75 km s-1 and thus there are some small differences from maps created with the classical |VLSR| > 70-90 km s-1 definition (e.g. Westmeier 2007, Wakker & van Woerden 1991). The clouds at both the positive and negative velocity extremes are largely associated with the Leading Arm and the tip of the Magellanic Stream, respectively. Since HVCs have not been catalogued in the velocity range obscured by Galactic emission, it is difficult to assess the dispersion of the population. Using the GSR frame, an estimate for the velocity dispersion of the HVCs is ~ 100-120 km s-1.
The HVCs have typical linewidths of 20-30 km s-1,
corresponding to velocity dispersions of
 = 8.5-13 km s-1
(Putman et al. 2002,
de Heij et al. 2002,
Kalberla &
Haud 2006).
This linewidth is indicative of a warm neutral medium for HVCs
at ~ 9000 K
(Hsu et al. 2011).
Many HVCs also show a narrow component
in their velocity profiles corresponding to cold gas at ~
< 500 K
(Kalberla &
Haud 2006).
The two-phase structure of HVCs is expected for
clouds in pressure equilibrium with a diffuse hot Milky Way halo medium
(Section 2.3;
Wolfire et
al. 1995).
It is possible that HVCs that do not show this two-phase structure are
currently in a more turbulent environment, or are embedded in a lower
pressure part of the halo.
= 8.5-13 km s-1
(Putman et al. 2002,
de Heij et al. 2002,
Kalberla &
Haud 2006).
This linewidth is indicative of a warm neutral medium for HVCs
at ~ 9000 K
(Hsu et al. 2011).
Many HVCs also show a narrow component
in their velocity profiles corresponding to cold gas at ~
< 500 K
(Kalberla &
Haud 2006).
The two-phase structure of HVCs is expected for
clouds in pressure equilibrium with a diffuse hot Milky Way halo medium
(Section 2.3;
Wolfire et
al. 1995).
It is possible that HVCs that do not show this two-phase structure are
currently in a more turbulent environment, or are embedded in a lower
pressure part of the halo.
HVCs have typical peak column densities of ~ 1019 cm-2, and a small number of clouds have peak column densities above 1020 cm-2 with the 4-15.5' resolution HI surveys (Putman et al. 2002, Hsu et al. 2011). Additional dense cores with HI column densities > 1020 cm-2 have been detected within some HVCs with synthesis observations (e.g., Wakker et al. 2002, Ben Bekhti et al. 2006). The clouds are found to extend down in column density to the limits of the HI observations (> 1017 cm-2; (Lockman et al. 2002, Braun & Thilker 2004). This suggests HI surveys may be detecting only a fraction of the area of many complexes, although they are likely to be detecting the majority of the HI mass (e.g., Peek 2009). There is also evidence that the clouds detected in HI emission are linked to lower column density absorption line systems (Ben Bekhti et al. 2012, Murphy et al. 1995, Nidever et al. 2010). At ~ 7 × 1017 cm-2 in HI emission the covering fraction is ~ 37% of the sky (Murphy et al. 1995, Lockman et al. 2002).
When the detailed HI structure of HVCs is examined, the clouds show evidence for being ionized by an external radiation field (Maloney & Putman 2003, Sternberg et al. 2002). The HI structure also often indicates the clouds are moving through a diffuse halo medium and being disrupted (Peek et al. 2007, Brüns et al. 2000, Stanimirovic et al. 2006, see Figure 4 and Section 5). Head-tail clouds, that form as the leading side of the HVC is compressed and gas is stripped behind it, are particularly abundant in the vicinity of the Leading Arm (Putman et al. 2011b).
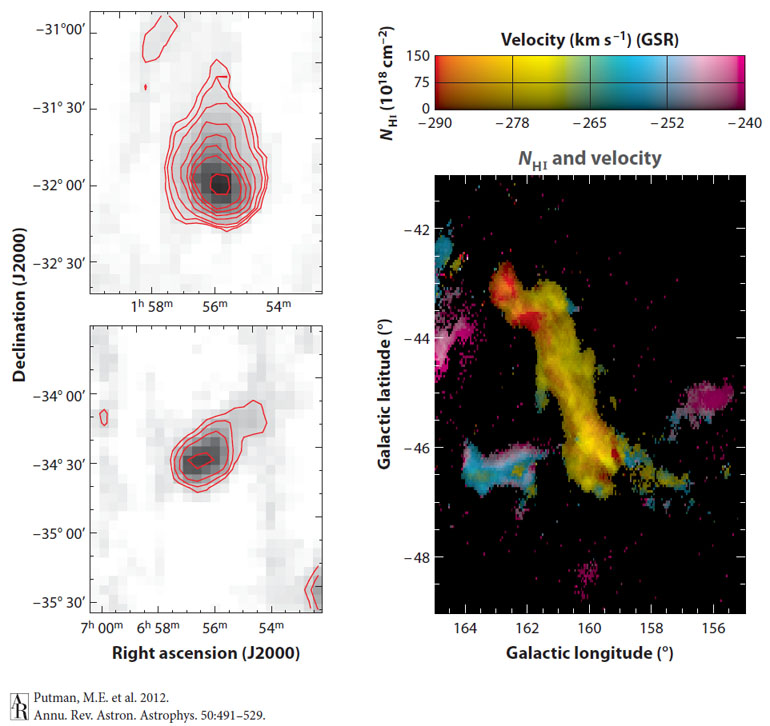 |
Figure 4. Left: Head-tail HI halo clouds with the outer contour at NHI = 2 × 1018 cm-2 (15.5' resolution; Putman et al. 2011b). Right: A HI HVC that shows signatures of interaction with the halo medium from the edge features (4' resolution; Peek et al. 2007). |
2.1.1 DISTANCES AND PHYSICAL PROPERTIES
HVC distance measurements allow for estimates of their physical
properties such as mass, size, volume density, and pressure (e.g.,
Wakker et al. 2001,
Hsu et al. 2011).
The best method to measure the distance to a HVC is to use a halo star
of known distance toward the cloud and search for absorption lines at
the HVC's velocity in the star's spectrum. A detection of absorption
from the HVC shows that the cloud is in front of the star, while not
detecting absorption may indicate the HVC is behind the star. Usually
the optical Ca II H and K and/or Na II doublet absorption lines from the
HVC are used for this distance measurement. Concluding the HVC is
behind the star with a non-detection requires very deep observations.
This is because the line of sight to the star may have a lower HI column
density than measured by the radio observations and there is uncertainty
in the gas-phase abundance of the metals
(Wakker et
al. 2001).
The identification of halo stars with the Sloan Digital Sky Survey (SDSS)
and other surveys has enabled distances to be obtained for almost all of
the large, labeled HVC complexes in Figure 1.
Most of the complexes are at distances between 2-15 kpc and z-heights
10 kpc
(Wakker et al. 2008,
Thom et al. 2006,
Thom et al. 2008,
Wakker et al. 2007),
Wakker et al., in
prep.), and, as viewed from the Galactic Center, they are within
30° of the disk plane. The clear exceptions to these distances are
the Magellanic Stream and Leading Arm, which are at ~ 55 kpc near
the Magellanic Clouds and may extend to 100-150 kpc at the tip of the
Stream (e.g.,
Besla et al. 2010).
The complexes can be viewed at their distances in the three-dimensional
map of Figure 3.
Distance measurements for HVCs obtained with halo stars are referred to
as direct distance constraints. Indirect distance constraints are model
dependent and available for almost all of the HVCs.
H observations of HVCs
can be used to estimate their distance if
one assumes that the H
emission is the result of the ionizing
radiation from the Galaxy reaching the surface of the cloud (the
fraction escaping normal to the disk is fesc ~ 6% in this
model;
(Bland-Hawthorn
& Maloney 1999,
Bland-Hawthorn &
Maloney 2002,
Putman et
al. 2003a,
Bland-Hawthorn &
Putman 2001,
Bland-Hawthorn et
al. 1998).
Most of the distances derived from
H observations of HVCs have
been consistent with their direct distance constraints using halo
stars. Clouds without direct distance constraints (in particular the
CHVCs) are also usually detected in
H emission, which is
consistent with them being within 40 kpc of the Galactic disk
(Tufte et al. 2002,
Putman et
al. 2003a).
The striking exception to the escaping radiation model is the Magellanic
Stream, which is too bright in
H emission given its
distance (see Section 2.2).
The most important additional indirect constraint on HVC distances is deep HI observations of systems similar to the Milky Way and/or Local Group. If one assumes the distribution of HVCs is similar, searches of Local Group analogs for HI clouds place even the compact HVCs within 80 kpc of the Galactic disk (Pisano et al. 2007) and deep observations of Andromeda suggest the clouds are within 50 kpc (Westmeier et al. 2007). The distance constraints have ruled out the possibility that the majority of the small HVCs are dark matter halos found throughout the Local Group (Blitz et al. 1999, Braun & Burton 1999). Recent Arecibo surveys are finding smaller clouds that do not yet have distance constraints (Giovanelli et al. 2010, Begum et al. 2010), but most of these clouds are associated with HVC complexes in position-velocity space (Saul et al. 2012).
The HI masses and sizes of HVC complexes can be determined once
distances are known. Calculating the HI mass requires a measurement of
the total flux of the cloud and is proportional to the square of the
distance.
Determining the physical size of a HVC requires scaling the observed
size directly with the distance, and this measurement may vary with the
beam size and sensitivity of the observations. The HI masses of the HVC
complexes (each consisting of many individual clouds) are in the range
of 105 - 5 × 10⁶
M , and
their sizes are a few to 15 kpc across (excluding MS and LA). There are
now enough distance constraints that we can determine the total mass in
halo clouds. For the 13 complexes with direct distance constraints, we
calculate the mass by placing each complex at the average of its upper
and lower distance limits. We place the remaining clouds ( ~ 23% of the
total HVC HI flux) at a distance of d=10 kpc, since the majority of the
complexes are at approximately this distance and indirect distance
constraints indicate there are not clouds at significantly larger
distances. This gives a total HI mass in non-Magellanic System HVCs of
2.6 × 10⁷
M.
This mass should be roughly doubled and multiplied by 1.4 to account for
the ionized component (Section 2.2) and Helium
respectively, thus giving a total mass of 7.4 × 10⁷
M. The
expected ongoing accretion rate from the HVC complexes is addressed in
Section 6.1. The Magellanic System alone
contributes a minimum of 3 × 10⁸
M
(d / 55 kpc)2 just in HI to the halo from the Magellanic
Stream, Leading Arm and Magellanic Bridge which joins the two Clouds
(Putman et
al. 2003b,
Brüns et
al. 2005).
Including the LMC and SMC galaxies would add another 7 ×
108
M
in HI to the Milky Way halo. All other satellites with HI gas are beyond
the virial radius of our Galaxy
(Grcevich &
Putman 2009).
, and
their sizes are a few to 15 kpc across (excluding MS and LA). There are
now enough distance constraints that we can determine the total mass in
halo clouds. For the 13 complexes with direct distance constraints, we
calculate the mass by placing each complex at the average of its upper
and lower distance limits. We place the remaining clouds ( ~ 23% of the
total HVC HI flux) at a distance of d=10 kpc, since the majority of the
complexes are at approximately this distance and indirect distance
constraints indicate there are not clouds at significantly larger
distances. This gives a total HI mass in non-Magellanic System HVCs of
2.6 × 10⁷
M.
This mass should be roughly doubled and multiplied by 1.4 to account for
the ionized component (Section 2.2) and Helium
respectively, thus giving a total mass of 7.4 × 10⁷
M. The
expected ongoing accretion rate from the HVC complexes is addressed in
Section 6.1. The Magellanic System alone
contributes a minimum of 3 × 10⁸
M
(d / 55 kpc)2 just in HI to the halo from the Magellanic
Stream, Leading Arm and Magellanic Bridge which joins the two Clouds
(Putman et
al. 2003b,
Brüns et
al. 2005).
Including the LMC and SMC galaxies would add another 7 ×
108
M
in HI to the Milky Way halo. All other satellites with HI gas are beyond
the virial radius of our Galaxy
(Grcevich &
Putman 2009).
The derivations of volume densities and pressures require additional assumptions about the HVCs and therefore should be adopted with some caution. For volume densities, it is often assumed the cloud's path length is similar to the size of the dimensions observed. For spherical clouds this may be a valid assumption if the linewidth does not seem unusually broadened. Volume density estimates for clouds with direct distance constraints are ~ 0.05-0.15 cm-3, and when simulated halo clouds are 'observed' the measured volume densities are within a factor of 3-4 of their actual volume densities (Wakker et al. 2001, Hsu et al. 2011). An estimate of a HVC's pressure is made with the ideal gas law using the derived volume density and the kinetic temperature calculated from the linewidth (see Section 2.1). Using the above range of densities and a temperature of 9000 K typical for the HVCs' warm neutral component, the pressures for the clouds with distance constraints are log(P/k) = 2.7 - 3.1 K cm-3. The HVCs are at z-heights from 3-9 kpc and the pressures derived are consistent with the calculations by Wolfire et al. (1995) for clouds in pressure equilibrium with a hot halo medium. The estimates for the pressures associated with the Magellanic Stream clouds are substantially lower, and this would be expected for clouds in a more distant, lower density halo medium (Stanimirovic et al. 2008, Hsu et al. 2011).
2.2. Warm Ionized and Warm-Hot Halo Gas
The warm gas (~ 104-5 K) in the Galactic halo is detected
with deep H emission
line observations and low and intermediate
ion absorption lines (e.g., Si II, Si III, C II, C III, O I) using
background QSOs or stars.
The H observations are
generally targeted toward known HI HVCs,
while the location of the absorption line observations are dictated by
the positions of background probes. Both methods have led to numerous
detections of warm Galactic halo gas. This gas probes the interaction of
HI clouds with photons from the disk and with other halo gas
(Section 4.2), and also comes directly
from the IGM and/or satellites
(Section 4.1 &
4.3).
There are numerous detections of HI halo clouds in
H emission with
Fabry-Perot instruments and deep long-slit spectroscopy
(Putman et
al. 2003a,
Tufte et al. 1998,
Tufte et al. 2002,
Bland-Hawthorn et
al. 1998,
Weiner &
Williams 1996,
Weiner et al. 2002).
All of the high-velocity
H detections are located
on or near HI HVCs. Extensions of the
H emission from the HI
have been noted for one complex
(Hill et al. 2009),
but this does not appear to be a generic condition
(Haffner 2005,
Haffner et
al. 2001,
Putman et
al. 2003a).
The detections of H
emission are typically < 0.5 Rayleigh (R), where 1 R is 106 /
4 photons cm-2
s-1 sr-1. There are some non-detections of
H emission for HVCs, but
it is possible they will be detected in the future if the cloud is fully
mapped to deep levels. One distinct non-detection may be the Leading Arm
of the Magellanic System, which is not detected in
H for numerous pointings
(< 30-50 mR). This is in contrast to the Magellanic Stream, which is
particularly bright in many locations and requires models that invoke
collisional ionization mechanisms beyond photoionization by radiation
from the disk
(Bland-Hawthorn
et al. 2007,
Weiner &
Williams 1996,
Putman et
al. 2003a);
Section 2.1.1 and
Section 4.2). The velocities of the HI and
H lines are
approximately the same for all HVC complexes, and there is no evidence
for a correlation between HI column density and
H brightness. Other
species such as [NII] and [SII] have also been detected in emission for
some HVCs
(Bland-Hawthorn et
al. 1998,
Tufte et al. 1998,
Putman et
al. 2003a).
photons cm-2
s-1 sr-1. There are some non-detections of
H emission for HVCs, but
it is possible they will be detected in the future if the cloud is fully
mapped to deep levels. One distinct non-detection may be the Leading Arm
of the Magellanic System, which is not detected in
H for numerous pointings
(< 30-50 mR). This is in contrast to the Magellanic Stream, which is
particularly bright in many locations and requires models that invoke
collisional ionization mechanisms beyond photoionization by radiation
from the disk
(Bland-Hawthorn
et al. 2007,
Weiner &
Williams 1996,
Putman et
al. 2003a);
Section 2.1.1 and
Section 4.2). The velocities of the HI and
H lines are
approximately the same for all HVC complexes, and there is no evidence
for a correlation between HI column density and
H brightness. Other
species such as [NII] and [SII] have also been detected in emission for
some HVCs
(Bland-Hawthorn et
al. 1998,
Tufte et al. 1998,
Putman et
al. 2003a).
The mass of the warm ionized component of halo clouds should be added to
the neutral hydrogen mass to obtain the total mass in halo clouds. The
H detections have been
used to calculate that the ionized component of the HVC complexes is on
the order of the mass of the neutral component in many cases
(Hill et al. 2009,
Wakker et al. 2008,
Shull et al. 2011).
This suggests the warm ionized component of the HVCs contributes 3-4 ×
107
M
to the Galactic halo (excluding the MS and LA; see
Section 2.1.1). It should be noted that the ionized
gas masses vary
by significant factors depending on if one assumes the ionized and
neutral gas are mixed together, or that the ionized gas forms a skin
around the neutral component. The numerous
H detections along
the Magellanic Stream indicate this feature also has a significant
amount of ionized gas associated with it (see also
Fox et al. 2010).
Absorption line observations are able to detect much lower column
density gas at a range of temperatures compared to emission line
observations. An important conclusion from the absorption line
observations is that multi-phase high-velocity gas covers a significant
fraction of the sky. A covering fraction of ~ 81% was found for
T ~ 104-4.5 K gas using high velocity Si III lines
(< NSi III = 2.6 × 10¹³
cm-2 >;
Shull et al. 2009,
Collins et
al. 2009),
and a similar covering fraction (> 60%) was
found for T ~ 105-6 K gas using O VI absorption
(NO VI > 2.5 × 1013 cm-2;
Sembach et
al. 2003).
These results can be used to infer that low column density ionized
hydrogen covers the majority of the sky (see also
Lehner et al. 2012).
Models show that the Si III absorbers represent photoionized
material, while the O VI is largely from collisionally ionized gas
produced as cool clouds interact with a hot halo medium
(Sembach et
al. 2003).
A combination of photo- and collisional ionization is commonly needed in
models to reproduce the line ratios for all sightlines
(Shull et al. 2011,
Fox et al. 2006,
Fox et al. 2010,
Haffner &
Madsen 2011).
Lehner & Howk
(2011)
recently constrained the distance to a collection of ionized HVCs
(IHVCs) using various ultraviolet absorption lines detected in the
spectra of halo stars. They found the ionized clouds with
|VLSR| < 170 km s-1 are within ~ 15 kpc
and contribute on the order of 108
M
in gas to the halo (assuming a metallicity of 0.2 solar; see also
Shull et al. 2009).
Thus, the largely ionized component of halo gas most likely dominates in
mass over the HI component, although one must be careful that the same
velocity cuts are made with these comparisons.
In Figures 1 and 2, high-velocity absorption lines are shown over the HI map of HVCs. The absorption line sightlines were not chosen to lie near HI complexes (Sembach et al. 2003, Shull et al. 2009), but in these maps it can be seen that the majority of the absorbers are in the spatial and kinematic vicinity of the HI complexes. In particular, an extension of the Magellanic Stream is evident with absorbers at high negative velocities (see also (Nidever et al. 2010, Lockman et al. 2002, Gibson et al. 2000). There are also extensions of Complexes C, A, and M and the W complexes, and many of the distance constraints for the ionized HVCs are consistent with those of the closest HI HVCs in position-velocity space. This map clearly shows that large scale multi-phase flows are active in the halo. There are some cases where the absorbers do not show a position-velocity link to complexes detected in HI. Most of these are at positive velocities and b > 45°. These largely ionized structures could be longer extensions of the W and LA complexes, gas along local galaxy structures (i.e., toward the Local Supercluster in the north or toward the Sculptor Group for the positive velocity absorber near the South Galactic Pole), or outflows from the disk (e.g., Keeney et al. 2006, Zech et al. 2008).
The hot gas ( ~ 106 K) in a spiral galaxy halo traces feedback mechanisms (Section 4.2), and potentially shock-heated IGM (Section 4.1). The extent and mass of this medium is of great interest to cosmological models of galaxy formation, as they predict it extends out to the virial radius and potentially hosts a large percentage of the galaxy's baryons (White & Rees 1978, Maller & Bullock 2004, Fukugita & Peebles 2006, Kaufmann et al. 2006, Sommer-Larsen 2006, Crain et al. 2010).
A hot Galactic halo and/or disk-halo medium is inferred to exist from x-ray observations in emission (Kerp et al. 1999, Wang & McCray 1993) and absorption (O VII and O VIII; (Williams et al. 2005, Wang et al. 2005), and from dispersion measures of pulsars at a range of distances (Taylor et al. 1993, Gaensler et al. 2008). Most of the hot gas detected directly in emission is thought to be within a few kpc of the disk (Fang et al. 2006, Yao & Wang 2007), and this is consistent with other galaxies (see Section 3.3). There is evidence for a lower density medium that extends out to at least the Magellanic System ( ~ 50-100 kpc) from several indirect methods. 1) The abundant detections of high velocity O VI absorption in the Galactic halo is attributed to the interaction of cool halo clouds with the hot halo medium (Sembach et al. 2003). 2) Satellite galaxies are stripped of their gas out to large radii, most likely as they move through this diffuse hot halo medium (Grcevich & Putman 2009, Blitz & Robishaw 2000). 3) The spatial and kinematic structure of the cold halo clouds indicate they are both supported and destroyed by a hot halo medium (see Section 5). 4) There is a low-density bipolar structure of unknown distance detected in x-ray (Bland-Hawthorn & Cohen 2003) and gamma-ray maps (Su et al. 2010) that is consistent with hot gas being sent into the extended halo.
Mass estimates for the hot halo medium are < 1010
M within
100 kpc of the disk (e.g.,
Collins et
al. 2005,
Anderson &
Bregman 2010,
Yao et al. 2008),
and the covering fraction is estimated to be > 60%
(Fang et al. 2006,
Sembach et
al. 2003).
As discussed further in Section 4, the amount
of hot gas in
the halo is below that predicted by cosmological simulations (see also
Bregman 2007),
but its extent makes it relevant to studies of large scale Galactic
winds and/or shock-heated IGM. The precise physical properties of the
extended hot halo medium remain uncertain, though densities are
generally determined to be between 10-5 and 10-4
cm-2 at 50-100 kpc with the indirect methods mentioned above
(Putman et
al. 2011b,
Hsu et al. 2011,
Stanimirovic
et al. 2006,
Grcevich &
Putman 2009,
Sembach et
al. 2003).
The temperature is usually assumed to be 1-2 × 10⁶ K for
these halo density estimates, consistent with the x-ray observations and
with expectations for gas in equilibrium with a Milky Way mass
halo. This temperature also happens to be consistent with the velocity
dispersion of the HI HVCs ( ~ 100-120 km s-1). There is a
great deal of additional work required to understand this
difficult-to-detect, low density, hot halo medium. In particular, the
distribution of this medium and its density at the virial radius need to
be measured in order to obtain a more accurate estimate of its total
mass.
2.4. Dust, Metals and Molecules
In this section we discuss the observations of dust and metals in halo gas and the limited detections of molecules. Halo dust and metals are direct tracers of the ejection of material from galaxies as they result from stellar evolution and supernovae. Small dust grains are the dominant heating mechanism of the cold neutral medium and metals the dominant coolant, so their abundances dictate the temperature structure of neutral halo clouds (Wolfire et al. 1995). Dust is destroyed by grain-grain collisions and by particle-grain collisions (sputtering) via shocks (Jones et al. 1996, Draine & Salpeter 1979a, Draine & Salpeter 1979b), and therefore halo dust properties can provide information on the dynamical history of the gas such as the launching mechanism. Understanding halo dust is also important for correcting the observed colors of extragalactic objects. The standard Galactic extinction map was made using a single grain size and composition for all Galactic gas, and a single temperature along a given line of sight (Schlegel et al. 1998). Metallicity measurements can further help to determine the origin of the gas (see Section 4), while molecular gas may point to future star formation in the halo.
Dust can be detected in the Galactic halo through far-infrared (IR) emission, depletion of refractory elements, and the reddening of light from distant objects. While far-IR emission provides a clean indication of dust in the disk, it is difficult to detect in the halo given the lower HI column densities and metallicities of halo clouds compared to the disk. HVCs may have less of their metals in dust grains (Wakker et al. 2001) and have cooler (and dimmer) dust. No definitive detections of HVC dust have been made with far-IR emission, although there are tentative detections of Complexes M and C (Peek et al. 2009, Planck Collaboration et al. 2011, Miville-Deschênes et al. 2005). Measuring the depletion of refractory elements onto grains can in principle indirectly show the presence of dust, but it is difficult given the unknown ionization states of the gas across species, the likely variation in inherent abundance patterns for clouds, and even the significant disagreement in the baseline non-depleted solar abundance ratios (Asplund et al. 2009). Nevertheless, there is no sign of the depletion of S and Si onto grains for Complex C (Collins et al. 2007, Tripp et al. 2003) or ionized HVCs (Richter et al. 2009), while evidence for dust depletion has been found for clouds associated with the Magellanic System (Lu et al. 1998, Fox et al. 2010). Reddening of background sources is independent of temperature and ionization state and may be used in the future to detect or rule out dust in Galactic halo gas at interesting levels.
Metallicity measurements trace the star-formation history of halo gas more directly than the dust. Metallicities have been measured primarily only for the large Complex C and Magellanic System complexes (MS and LA; see Figures 1 - 3), although additional estimates will be obtained with future Cosmic Origins Spectrograph (COS) observations (Wakker 2009). Metallicities for Complex C are 10-30% solar, and there is some evidence for mixing with Galactic material at low latitudes (Shull et al. 2011, Collins et al. 2007). The nearby Complex A has a similar measurement (Wakker et al. 2001). The deuterium abundance was also measured for one sightline in Complex C and is consistent with cosmological expectations (N(D I) = 2 × 1015 cm-2; D / H = 2.2 × 10⁻⁵; (Sembach et al. 2004). The Magellanic Stream and Leading Arm metallicity determinations are also ~ 10-30% solar (Fox et al. 2010, Gibson et al. 2000, Lu et al. 1998, Sembach et al. 2001). This metallicity, and the relative abundances, have been used to support an SMC origin for MS and LA; however, the metal content of these features depends on when, and from what region, the gas was stripped from the Magellanic Clouds.
Molecular gas has only been detected along a few sightlines through HVCs. H2 was detected in the Leading Arm and Magellanic Stream ( ~ 1016-17 cm-2; (Sembach et al. 2001, Richter et al. 2001). It was not detected toward a sightline through Complex C, but this may be due to a low HI column along the sightline (Richter et al. 2003). CO and H2 was detected in the bridge of gas connecting the LMC and SMC, which is consistent with the star formation in the Magellanic Bridge (Muller et al. 2003, Lehner 2002).
Observations of gas at the disk-halo interface help to determine the relationship between halo gas that comes from the disk and halo gas that fuels the disk. For the Milky Way, the gas at the interface between the disk and halo has traditionally been studied separately from the halo gas. The notable exception is the hot gas because the velocity resolution of these data do not allow the two to be separated. Defining individual objects at the disk-halo interface is difficult at any wavelength. Objects are defined with HI data with the large intermediate velocity clouds (IVCs) and a population of small discrete clouds, but at other wavelengths the properties of the entire gas layer are usually presented.
For the cold gas, the thickness of the HI layer in the inner Galaxy is
220 pc, but approaches < 100 pc in the nuclear regions and flares
dramatically at R >
R
(Dickey &
Lockman 1990,
see Figure 6). In some regions,
there are kpc extensions from the disk due to the presence of IVCs or
the Galactic warp
(Levine et al. 2006,
Kalberla &
Dedes 2008).
There is observational evidence that the HI temperature increases with
increasing z-height. This is also seen in the warm and warm-hot gas (see
below). Determining the variation in the movement of the gas with
z-height is difficult given our location. The model of
(Levine et al. 2008)
has a vertical falloff of the rotation curve of -22 ± 6 km
s-1 kpc-1 near the disk, while
(Marasco &
Fraternali 2011)
find lower values of -15 ± 4 km s-1
kpc-1. Both the temperature and kinematic gradient of the
disk-halo gas is depicted in Figure 5.
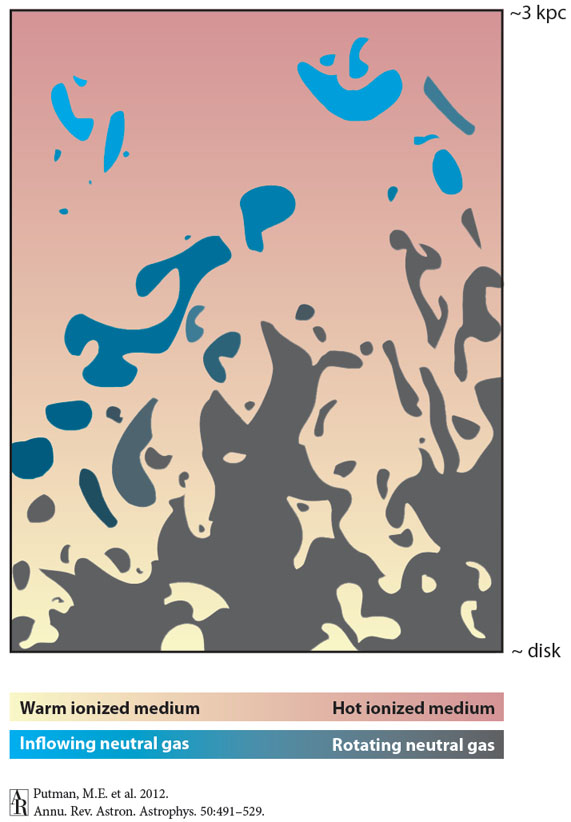 |
Figure 5. A cartoon representing the disk-halo interface given the observations discussed in Section 2.5 and Section 3. The temperature gradient for the diffuse gas is shown with the pink color bar, while the kinematic gradient of the denser neutral gas (HI) is shown by the blue-gray shading. There are distinct populations of large IVCs and small discrete clouds, but in reality the edges of the HI features are not this sharp. |
The large HI IVCs are not easy to isolate as individual objects due to
their connection to Galactic HI. They are found to reach z-heights of
1-2 kpc and their HI mass estimates are 0.5-8 × 10⁵
M. IVCs
have near-solar metallicities
(Wakker et al. 2001,
Wakker et al. 2008),
and dust is readily detected through IR emission. IVCs tend to have
somewhat smaller, hotter dust grains than the disk, consistent with dust
shattering through shocks
(Heiles et al. 1988,
Peek et al. 2009,
Planck Collaboration
et al. 2011).
Small amounts of molecular gas have been detected in numerous IVCs with
H2 column densities of 1014-17 cm-2,
consistent with the presence of dust
(Richter et
al. 2003).
Deuterium has also been detected
(Savage et
al. 2007).
Recently a large number of small, discrete HI clouds have been
identified as a distinct disk-halo population and modeled as clouds
rotating with the Galaxy at z-heights of 1-2 kpc
(Begum et al. 2010,
Saul et al. 2012,
Ford et al. 2010,
Lockman 2002,
Kalberla &
Kerp 2009).
The GALFA-HI survey has classified the largest population of these
clouds ( ~ 1250), and can split the discrete HI clouds at intermediate
velocities (20-90 km s-1) into a cold (T < 5000 K)
population that appears to be relatively uniformly distributed and
related to the disk, and a warm population that has a bias toward
negative velocities and is distributed similarly to the large IVCs
(Saul et al. 2012).
The HI mass of the clouds depends on their distance and range from ~ 1
M for
clouds at high Galactic latitudes at a distance of 1-2 kpc
(Saul et al. 2012),
to ~ 700
M for
clouds toward the inner galaxy with distances obtained with the tangent
point method
(Ford et al. 2010).
The metallicity and dust content of these clouds has not yet been measured.
The warm gas detected in H
emission at the disk-halo interface is
referred to as the Reynolds or warm ionized medium (WIM) layer
(Haffner et
al. 2003,
Reynolds 1993).
This is a layer of warm gas extending ~ 2 kpc above the disk with a
volume averaged density of 0.01 - 0.1 cm-3 and a filling
factor of >30% at 1-1.5 kpc
(Reynolds 1991,
Gaensler et
al. 2008,
Haffner et
al. 2009).
As illustrated in Figure 5, at lower z-heights
more of the volume is filled in with HI and at higher z-heights the hot
gas fills more of the volume
(Savage & Wakker
2009,
Gaensler et
al. 2008).
The scale height of gas at multiple temperatures, as well as its
relation to the Galactic disk, has been investigated via absorption line
studies
(Savage & Wakker
2009,
Bowen et al. 2008).
The cool and warm components have scale heights calculated from the
absorption line results that are consistent with that obtained from the
emission line observations. The warm-hot gas, that is often referred to
as transition temperature gas, is observed with Si IV, C IV
and O VI absorption lines and has a larger scale height ( ~ 3-4.5
kpc) than the cold and warm gas. This warm-hot halo gas is found toward
the vast majority of the sightlines in the Galactic disk. The disk-halo
interface region is discussed further in
Section 6.2.