

Here, I provide an overview of the observations and physics of star-forming molecular clouds in the Galaxy and nearby normal galaxies. The motivation is to develop the intuitive background for analysis of observations at high redshift, hopefully avoiding naive and simplistic assumptions. The physics of the molecular ISM is not at all what one would have guessed before the advent of mm-line astronomy and the understanding developed over the last 30 years is vital to galactic evolution studies.
All known star formation in low-redshift galaxies occurs in molecular gas clouds and inclusion of atomic Hi clouds in discussions of star formation is a `red herring', except in as much as the atomic gas may feed the buildup of molecular clouds. In fact, there is no instance of star formation demonstrably observed to occur in atomic gas in nearby galaxies (as distinct from atomic gas dissociated by recently formed stars). Even in the extended ultraviolet (UV) disks of nearby galaxies, the young stars producing the UV could have been formed from molecular clouds simply too low in mass or surface density to be detected in present observations. The dominant process for formation of hydrogen molecules (H2) at low redshift is believed to be on the surface of dust grains where two H atoms remain in proximity long enough for a radiative decay to a bound state. The hydrogen molecule is dissociated from the ground state by a two-step process involving UV photon absorption in the Lyman and Werner bands longward of the Hi Lyman limit, followed by radiative decay to unbound vibrational states in the ground electronic state (Hollenbach et al. 1971). Thus, the destruction rate for H2 depends sensitively on the ambient UV radiation field and hence on the amount of dust extinction and H2 column density to the cloud surface - the latter since the foreground H2 may absorb all the incoming UV when the H2 Lyman and Werner bands become optically thick (i.e., self-shielding). Thus, whether a gas parcel is atomic or molecular will depend complexly on a number of factors: the volume density (since the formation rate depends on the densities of dust and atoms), the clumping of the ISM and the column density to the cloud surface and velocity dispersion which determine the dust continuum and H2 line opacities. For typical cloud densities of a few hundred per cm-3, the phase transition from Hi- to H2-dominated will occur at a column density NH+2H2 ~ 2 × 1021 cm-2, corresponding to an extinction AV = 1 mag for a standard dust to gas abundance ratio (Hollenbach et al. 1971).
The H2 molecule is homonuclear and therefore has no permanent
dipole moment - its pure rotational transitions are weak
quadrupole transitions with low emissivity. In addition, H2
has a small moment of inertia and its first rotational transition
(J = 2-0) at 28.2 µm is therefore at relatively
high energy (h /
k
/
k  508 K),
requiring a minimum gas temperature of Tk ~ 150 K for
appreciable collisional excitation. Thus trace molecules such as CO and
HCN have become the standard surrogate probes of molecular clouds. CO
and HCN have dipole moments of 0.1 and 2.3 Debye, respectively, and
their larger moments of inertia (due to having heavier atoms than H)
yield lowest rotational transitions at 115.2 and 88.6 GHz (2.6 and
3 mm wavelength), corresponding to
h/k
5.5 and 4.2 K (see
Fig. 8.1). These molecules also have rare
isotopic forms (e.g., 13CO and C18O) with slightly
different moments of inertia, and hence shifted rotational lines which
can be used to probe regions of high column density where the abundant
isotope lines are very optically thick.
508 K),
requiring a minimum gas temperature of Tk ~ 150 K for
appreciable collisional excitation. Thus trace molecules such as CO and
HCN have become the standard surrogate probes of molecular clouds. CO
and HCN have dipole moments of 0.1 and 2.3 Debye, respectively, and
their larger moments of inertia (due to having heavier atoms than H)
yield lowest rotational transitions at 115.2 and 88.6 GHz (2.6 and
3 mm wavelength), corresponding to
h/k
5.5 and 4.2 K (see
Fig. 8.1). These molecules also have rare
isotopic forms (e.g., 13CO and C18O) with slightly
different moments of inertia, and hence shifted rotational lines which
can be used to probe regions of high column density where the abundant
isotope lines are very optically thick.
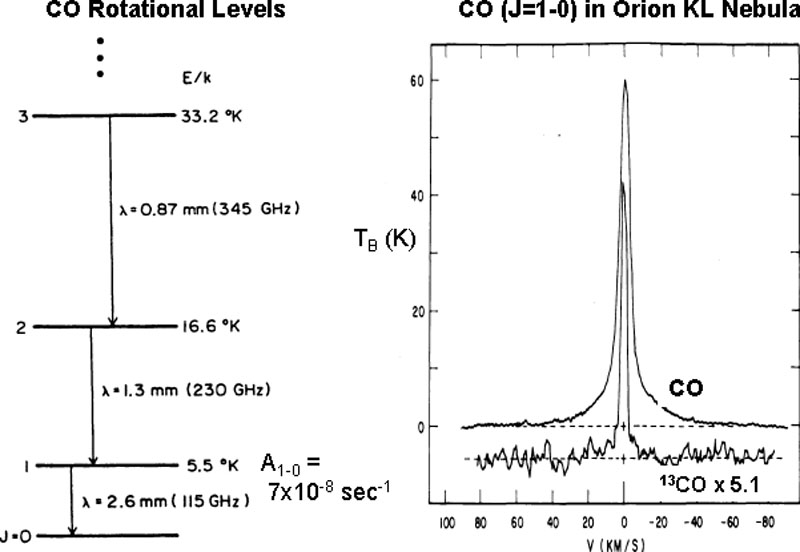 |
Figure 8.1. The low-lying rotational levels
of CO are shown on the left; the spontaneous decay rate for the
J = 1-0 transition is 7 × 10⁻⁸ sec-1
and the critical density for pure collisional
excitation by H2 is ~ 3000 cm-3. With line photon
trapping and a typical optical depth of
|
Excitation for the rotational levels of molecules like CO observed at mm
and submm wavelengths is provided by collisions with H2. If
these collisions are sufficiently frequent (compared to the spontaneous
decay rate) the levels will come into thermal equilibrium with the
H2 and their excitation temperature will approach the gas
kinetic temperature. For optically thin transitions, this occurs at the
critical density
nH2,crit = Au-l
/< u-l>
where Au-l is the Einstein spontaneous
decay rate (7 × 10⁻⁸ sec-1 for CO,
J = 1-0), and
<
u-l> is the
collisional
de-excitation rate averaged over the Maxwellian distribution of
H2 thermal velocities. For CO (J = 1-0) this critical
density is ~ 3000 cm-3 and for HCN (and most other
molecules) it is ~ 104-5 cm-3 due to their
higher dipole moments and therefore higher A coefficients. Hence,
the non-CO molecules are generally taken as probes of high-density
molecular gas as compared with that traced by CO.
u-l>
where Au-l is the Einstein spontaneous
decay rate (7 × 10⁻⁸ sec-1 for CO,
J = 1-0), and
<
u-l> is the
collisional
de-excitation rate averaged over the Maxwellian distribution of
H2 thermal velocities. For CO (J = 1-0) this critical
density is ~ 3000 cm-3 and for HCN (and most other
molecules) it is ~ 104-5 cm-3 due to their
higher dipole moments and therefore higher A coefficients. Hence,
the non-CO molecules are generally taken as probes of high-density
molecular gas as compared with that traced by CO.
Measurements of the rare 13C isotopes of both CO and HCN indicate that the 12CO emission is optically thick. The rare isotopes are typically seen at an intensity approximately 0.1-0.5 of the abundant species whereas the ISM abundance ratio is C/13C = l/89-1/40, implying that the emission from the abundant species is optically thick and therefore saturated (see Fig. 8.1, right). For optically thick transitions, the upper-level population can be enhanced due to absorption of line photons, leading to excitation temperatures higher than those expected simply due to H2 collisions, since the line photons emitted upon spontaneous decay cannot easily escape the cloud. This so-called radiative trapping of the line photons builds up the radiation field at the frequency of the line, leading to enhanced excitation of the upper state via photon absorption.
The escape probability formalism used to treat this optically thick situation was first applied to molecular clouds by Scoville & Solomon (1974) and Goldreich & Kwan (1974) and is now routinely used to analyse interstellar molecule excitation (often called large velocity gradient [LVG], non-thermal equilibrium [non-LTE] analysis; see, e.g., van der Tak et al. (2007) and their publicly available RADEX code) 1. One of the biggest advantages of the LVG formalism is that it permits treatment of the coupled radiative transfer and molecular excitation as a local problem - a fact probably not fully appreciated by current routine users of these codes. This formalism is applicable to situations in which systematic velocity gradients are large compared to the small-scale thermal motions. The line photons from one region of the cloud are then incoherent with other regions due to the Doppler shift; they can then only interact with molecules in the local region near where they were emitted.
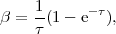
In the photon trapping regime, the spontaneous decay rates (A)
used in analysing the equilibrium molecular excitation are reduced by a
factor  equal to the effective probability for escape of line
photons from the emission region
(Scoville & Solomon
1974;
Goldreich & Kwan
1974).
Thus, the
equal to the effective probability for escape of line
photons from the emission region
(Scoville & Solomon
1974;
Goldreich & Kwan
1974).
Thus, the
critical density for thermalisation of
the levels is reduced by the same factor
. For a
spherically symmetric cloud with radial velocity field
(
 r), the escape
probability is given by
r), the escape
probability is given by
 |
(1) |
where
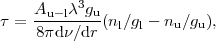 |
(2) |
for  ≪ 1,
= 1 and for
≫ 1,
=
1/. Thus the critical
density is reduced by a factor of
in the optically thick
regime. For most giant molecular clouds (GMCs - see below),
CO
≪ 1,
= 1 and for
≫ 1,
=
1/. Thus the critical
density is reduced by a factor of
in the optically thick
regime. For most giant molecular clouds (GMCs - see below),
CO
 10 (based on
the relative strength of 13CO), so the critical density of CO
(1-0) is reduced from 3000 to 300 cm-3. Thus, the CO
excitation temperature
will be approximately thermalised at the gas kinetic temperature
(Tk)
in most clouds. And since the CO line is optically thick, the brightness
temperature at the emission line peak will indicate the
H2 kinetic temperature.
10 (based on
the relative strength of 13CO), so the critical density of CO
(1-0) is reduced from 3000 to 300 cm-3. Thus, the CO
excitation temperature
will be approximately thermalised at the gas kinetic temperature
(Tk)
in most clouds. And since the CO line is optically thick, the brightness
temperature at the emission line peak will indicate the
H2 kinetic temperature.
Similar considerations apply for the optically thick lines of molecules
such as HCN and CS which have higher dipole moments - i.e., their
critical densities are reduced by a factor
1/ but since those
critical densities are higher than that of CO, their excitation
temperatures and line brightness temperatures will be subthermal (except
in the densest cloud core regions). In fact, since the critical density
for optically thick transitions is
nH2,crit = (Au-l
/ ) / <
u-l>, the radiative
line strength (appearing in the A-coefficient in the numerator
and in in the denominator)
cancels out - i.e., the critical
density then just depends inversely on the molecular abundance.
In the regime of photon trapping, one should not assume that the emission of a rare isotope like 13CO is optically thin simply because it is observed to have lower intensity than the abundant isotope emission. The rare isotope may simply have a lower excitation temperature since it has less photon trapping. This fact is under-appreciated by `casual' observers. Typically, the 13CO emission is 1/5 to 1/10 of CO - does this mean the optical depth is always in the small range 1/5 to 1/10? - of course not!
Molecular excitation can also be provided by absorption of continuum
photons - either the IR continuum of dust or the cosmic microwave
background radiation (CMB). In the escape probability formalism it is
easy to include such continuum excitation. If
is the
probability of a line photon escaping from the local region, then
is also the
probability of an externally produced background photon making it into
the local volume. The low-lying molecular levels will maintain a base
excitation temperature at the cosmic background level, 2.7 ×
(1+redshift) K (even in the absence of H2
collisions). However, since the line observations measure only the
excess emission above the local continuum background, this CMB
excitation does not result in detectable emission. The continuum from
dust emission is not generally important for exciting low-lying
molecular levels at mm wavelengths (since the continuum is optically
thin and weak); but for higher-energy transitions at
 rest <
500 µm the IR continuum should be included.
rest <
500 µm the IR continuum should be included.
In summary, we can expect that:
Tk(H2).
 104-5
cm-3.
104-5
cm-3.
8.1.3. Observed properties of molecular gas
Extensive surveys of the CO and 13CO (J = 1-0 at
= 2.6 mm and J
= 2-1 at = 1.3 mm)
emissions in the Galaxy have been used to determine the overall
distribution of star-forming H2 gas and its properties
(Scoville & Solomon
1975;
Sanders et al.
1985;
Dame & Thaddeus
1985;
Scoville et al.
1987;
Clemens et al.
1988;
Matsunaga et al.
2001;
Dame et al. 2001;
Jackson et al.
2006).
CO emission is ubiquitous at all Galactic longitudes in
the inner Galaxy (|l| < 90°) and within
1° latitude of the Galactic plane. The CO emission is
particularly strong in the central 1° around the
Galactic centre and within an annulus/ring from |l| = 20-50
degrees - the so-called molecular cloud ring at 3-7 kpc
radius. This concentration of the H2 to the interior of the
Galaxy is remarkably different from that of
Hi; the 21-cm
Hi distribution is much
smoother and the overall Hi
distribution is fairly constant with Galactic radius out to
R ~ 12-15 kpc with mean column density
perpendicular to the plane of < NH >
1021 cm-2 (see Fig. 8.2).
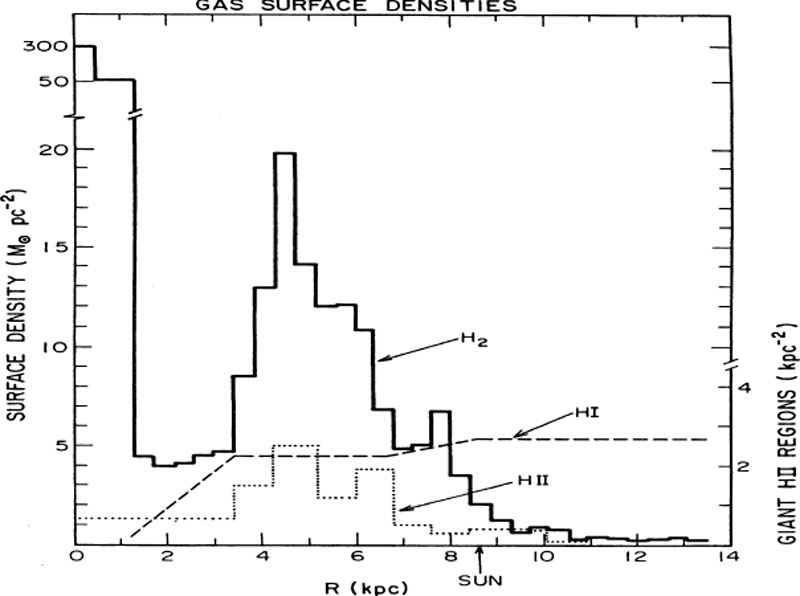 |
Figure 8.2. The gas surface densities in
the Milky Way disk are shown for H2
(Clemens et al.
1988),
Hi
(Burton & Gordon
1978)
and giant Hii regions
( |
Within the Galaxy the overall mass contents of the molecular and atomic
gas are approximately equal (~ 2 × 10⁹
M in
each) but most of the
molecular gas is inside the Solar-circle whereas most of the
Hi is outside
8.5 kpc. Since the total Galactic star formation rate is ~
3M per yr,
the characteristic cycling time for H2 into new stars is
~ 2 × 10⁹
M /
3M /
yr ~ 109 yr. Thus, the H2 clouds are
forming stars at a rate much slower than their free-fall collapse time
within the clouds ((G
in
each) but most of the
molecular gas is inside the Solar-circle whereas most of the
Hi is outside
8.5 kpc. Since the total Galactic star formation rate is ~
3M per yr,
the characteristic cycling time for H2 into new stars is
~ 2 × 10⁹
M /
3M /
yr ~ 109 yr. Thus, the H2 clouds are
forming stars at a rate much slower than their free-fall collapse time
within the clouds ((G
 )-1/2 ~ 3-5 Myr) but on a timescale much shorter
than the Galactic lifetime. Star formation is inefficient but a resupply
of gas is required if star formation is not to die out in the next
Gyr (which seems unlikely).
)-1/2 ~ 3-5 Myr) but on a timescale much shorter
than the Galactic lifetime. Star formation is inefficient but a resupply
of gas is required if star formation is not to die out in the next
Gyr (which seems unlikely).
The smaller-scale distribution of CO emission indicates that the H2 gas resides in discrete clouds, rather than a diffuse, continuous medium. Along a typical line of sight in the Galactic plane there will be three to six kinematically discrete CO emission features, occupying a small fraction of the overall permitted velocity range. Spatial mapping of the individual emission features indicates extends perpendicular to the line of sight typically 10 to 80 pc - hence the name, Giant Molecular Clouds (GMCs).
The Orion GMC (actually two clouds) is the nearest GMC with an overall
extent of 40 pc (see Fig. 8.3) - in
striking contrast to the optically visible Orion Nebula (M 42) for which the extent is
 1 pc! In the
vicinity of M 42, the
CO brightness temperature increases to a peak of ~ 60 K (see
Fig. 8.1, right), compared to 5-20 K in most of
the rest of
the cloud. These elevated temperatures are largely due to heating by the
dust-embedded cluster of young stars in the Kleinmann-Low (KL) IR
source, located behind the visible Trapezium/M 42 OB star cluster.
1 pc! In the
vicinity of M 42, the
CO brightness temperature increases to a peak of ~ 60 K (see
Fig. 8.1, right), compared to 5-20 K in most of
the rest of
the cloud. These elevated temperatures are largely due to heating by the
dust-embedded cluster of young stars in the Kleinmann-Low (KL) IR
source, located behind the visible Trapezium/M 42 OB star cluster.
 |
Figure 8.3. The star-forming complex in Orion provides a close view of the complexity of both the ISM and the star formation activity. The left panel shows a very large-scale image of the FIR emission as imaged by the IR astronomical satellite (IRAS) (Courtesy NASA/JPL-Caltech). The upper-right panel shows the integrated CO (1-0) line emission from the two Orion GMCs (Ripple et al. 2012). A Hubble Heritage image of the visible Hii region M 42 is shown at the lower right - the visible Hii region occupies a very small area of the Orion complex, as outlined in the IRAS image. |
The gas heating associated with the KL nebula (and other IR sources associated with active star formation) occurs in two steps: heating of the embedding dust by absorption of photons emitted by the young stars, followed by H2 heating through collisions with the heated dust grains. Thermal equilibrium between the dust and the H2 is theoretically expected to occur at gas densities nH2 > 104 cm-3 (Goldreich & Kwan 1974). Indeed, the dust colour temperature in KL is ~ 60 K, i.e., similar to the gas kinetic temperature determined from the CO line brightness temperature.
8.1.3.1. Self-gravitating GMCs
One of the most perplexing and still not understood features of the GMCs
is their large velocity dispersions, as determined from the width of the
molecular emission lines. At gas temperatures of 10-80 K, the thermal
velocity dispersion (sound speed) should be ~ 0.1-0.3 km/s, yet the
observed velocity dispersions are typically 1-4 km/s. The
linewidths are correlated with cloud diameter, D. The observed
relation is V =
0.31Dpc0.55 km/s
(see Fig. 8.4). Thus the kinetic energy in
large-scale supersonic motions is ~100 times the expected thermal
energy. The containment of these supersonic turbulent motions is
provided by the self-gravity of the molecular gas within each
cloud. Independent estimates of the cloud masses using both dust
extinction measurements and non-LTE analysis of the molecular lines,
indicate
approximately enough gas mass for the GMCs to be
self-gravitating and in virial equilibrium with the observed internal
motions. Nevertheless, it should be pointed out that although the
kinetic energy and gravitational potential energy approximately balance,
the GMCs do not have the expected spherical shapes; they are often
elongated and have internal filamentary or sheet-like structures.
 |
Figure 8.4. The internal velocity dispersions of GMCs are shown as a function of diameter for clouds with and without giant Hii regions, i.e., Hii regions more luminous than M 42 (Scoville et al. 1987). This illustrates the empirical correlation found between cloud size and linewidth (the so-called size-linewidth correlation). The Hii region clouds depart from this size-linewidth at low masses/sizes presumably due to feedback effects from massive star formation. |
In any case, it is clear that the GMCs are not in pressure equilibrium with the external diffuse Hi and Hii phases of the ISM. Their pressures are generally taken to be nT = 3000 cm-3 K, i.e., a factor of 100 lower than the turbulence pressures within the GMCs as reflected in their internal velocity dispersions.
Given that the GMCs are self-gravitating, one can obtain their mean densities as a function of cloud diameter using the above empirical relation between the velocity dispersion and cloud diameters (i.e., the observed size-linewidth relation):
 |
(3) |
where the scaling is to 40 pc - the size at which half of the overall
Galactic H2 mass is in clouds larger and half is in clouds
smaller. The cloud mass distribution function is N(M)
M-1.6. For a cloud of diameter
40 pc, the above relation implies a mass of 4 × 10⁵
M
(including the 36% mass contribution of He).
8.1.3.2. Molecular masses from
≫ 1 CO emission
How is it that the emission in optically thick CO lines can be
used to estimate the total mass of H2 in galaxies? Observers
of extragalactic CO commonly make use of a so-called X-factor or
 CO to
translate measurements of CO emission into estimates of molecular gas
masses - let us see how this is physically justifiable.
CO to
translate measurements of CO emission into estimates of molecular gas
masses - let us see how this is physically justifiable.
For a resolved cloud the integrated line brightness temperature,
LCO =
∫ TB dv, can be integrated
over the projected area of the
cloud to yield a `luminosity' LCO =
d2 ∫ ICO
d where d is the distance to the cloud. Thus,
 |
(4) |
where R is the radius of an assumed spherical cloud. For clouds
in virial equilibrium,
 V =
(GM / R)1/2 and therefore,
V =
(GM / R)1/2 and therefore,
 |
(5) |
where
is the mass density. Equation 8.5 predicts a linear scaling
between cloud mass and the CO luminosity provided the clouds have
approximately similar mean density and temperature. Equation 8.5
indicates that the constant of proportionality between
LCO and M will vary as
T / 1/2. Physically, what is going on here?
Although the CO line is
optically thick (and often thermalised), the increased mass of larger
clouds gets reflected in an increased surface area emitting CO photons
and an increased linewidth over which they are emitted.
Figure 8.5 illustrates the extremely good
empirical correlation between
measured CO luminosities and their virial masses (determined from resolved
measurements of the size and linewidth). In fact, if the temperatures are
determined by radiative heating of dust within the cloud (plus a low-level
background heating by cosmic rays heating the gas to ~10-15 K), the
overall range of mean temperatures is expected to be rather small. The dust
radiatively cools as
TD5-6 and it is hard to get the dust
much above 40 K except in very localised regions of active star formation.
Typical FIR colour temperatures of GMCs are in the range 20-40 K and only a
few ultra-luminous IR galaxy (ULIRG) nuclei get up to 60 K. Regions with
elevated gas temperatures and hence high TB(CO)
are also likely to be denser (since their high temperatures probably
reflect more concentrated star formation due to higher gas density). The
effects of increased temperature and density will therefore partially
compensate each other (see Equation 8.5).
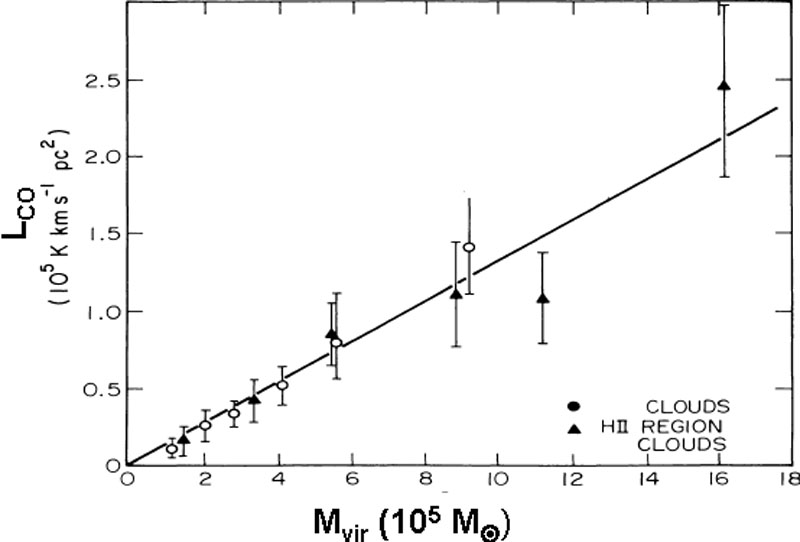 |
Figure 8.5. The CO luminosities of GMCs are shown as a function of their virial masses for clouds with and without giant Hii regions (Scoville et al. 1987). |
For extragalactic observations where individual GMCs are not resolved, Equation 8.5 can still be used since the total CO luminosity is just the sum of that of the individual clouds, provided the GMCs do not overlap both on the sky and in velocity (unlikely given their small-volume filling factor in normal galaxies). In the extragalactic observations, the cloud diameters are not usually measurable but the unresolved apparent brightness temperatures vary as distance d-2 so that the distance to the galaxy may replace R in Equation 8.4. For the external galaxies, Equation 8.5 is translated to
 |
(6) |
where CO
4.9
(Solomon & Barrett
1991).
We should also note that for modest changes in metallicity (affecting
the CO abundance relative to H),
CO will
change slowly (until CO becomes optically thin in large areas) - this is
dramatically demonstrated by the fact
that 13CO luminosities of clouds are typically only a factor
of 4-10 times lower than those of CO despite the much lower abundance
ratio of 13C/C
(1/40 → 1/90). For the optically thick regime where photon trapping is
important for the CO excitation, one can show analytically that the
CO should
scale as CO abundance or metallicity Z-0.4 (see
Scoville & Solomon
1974).
One instance where the above analysis must be modified is in a galactic nucleus if the gas is smoothly distributed in the central galactic potential. Here, the CO linewidth will be determined not by the self-gravity of individual clouds but instead by that of the stars plus the gas, i.e., the linewidth will be larger than that associated with just the gas mass. There will then be more CO photons emitted per unit gas mass. For parameters associated with the most extreme cases in ULIRGs, the CO conversion factor may be reduced by factors of 2-5 (see Downes & Solomon 1998 and Bryant & Scoville 1999). In the photon trapping regime, the CO excitation temperature (and hence the brightness temperature) of the line will vary as the molecular abundance to the ~ 0.4 power (Scoville & Solomon 1974). Thus, one expects that the CO line emissivity to mass conversion factor will vary with metallicity as Z-0.4 at high redshift where the metallicities are generally lower.
Although much current theoretical analysis of star formation adopts the point of view that GMCs are relatively short-lived (10-30 Myr), I would like to provide several arguments why this can't be the case. These arguments were well known in the early days of molecular line astronomy but seem to have been overlooked in current discussions.
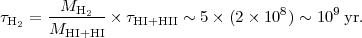
The first argument is simply based on the required conservation or continuity of ISM mass between the various ISM phases (Hi, Hii and H2). If the GMCs, or more specifically the H2 molecules, are short-lived then there must be cycling of gas between these phases. The mass flux from one phase to another and back must then be in equality (see Scoville & Hersh 1979; Koda et al. 2009). This mass flux equality is given simply by
 |
(7) |
where we assume relatively little cycling to young stars (since that timescale was found to be ~ 1 Gyr above). In the interior of our Galaxy and most nearby spirals, the H2 dominates in mass compared to Hi and Hii by a substantial factor (e.g., more than a factor of five in the Galactic molecular cloud ring). Thus if cycling between the phases is to be plausible at all (without disobeying mass conservation!) at these interior radii, the timescale for a molecule to remain a molecule must be correspondingly longer than the timescale for a particle in the diffuse phases (Hi or Hii) to remain atomic or ionic. The latter might be expected to be given by the dynamical time at density a few H cm-3 (~ 108 yr) or by the time needed to pass between the compressive spiral arms (also ~ 2 × 10⁸ yr). Inverting the mass continuity equation (Equation 8.7), one finds:
 |
(8) |
Thus, for cycling between the phases to work, the characteristic lifetime of a H2 molecule should be at least several times 108 yr. And if there is no such cycling, then the timescale is even longer. Although this calculation was done for the interior of the Galaxy where H2 dominates Hi, the estimate can be expected to hold elsewhere since it is in the interior of the Galaxy where there is the most disruptive feedback from star formation and other processes. In addition, the internal structure of the GMCs in the outer Galaxy is probably similar to that in the inner Galaxy (i.e., they are equally difficult to disrupt).
One must note that this is the timescale for a molecule to remain a molecule and not necessarily the timescale for a given GMC to retain its physical structure. Clouds may and probably do grow within the spiral arms and fragment into smaller clouds outside the arms - but the molecules cannot cycle all the way back to the diffuse Hi or Hii phases on a short timescale.
Another line of reasoning suggesting long GMC lifetimes is the fact
that, in general, feedback processes from star formation within the
GMCs are inefficient at disrupting the massive clouds
(Scoville & Hersh
1979;
Scoville 2003;
Murray et al.
2010).
Most of the
stellar feedback will be radiated and dissipated in shock fronts or leak
out the cloud boundaries (as is surely the case in M 42). The total
momentum needed to unbind the clouds is enormous, typically
~ 5-10 × 105
M
km/s. Lastly, I
point out that the scaleheights (perpendicular to the Galactic disk) of
the GMCs as a function of their mass suggest that they have achieved
approximate equipartition. In Fig. 8.6,
the z-scaleheights of clouds indicate
that z
Mvir-0.4, i.e.,
approximately the 1/2 power expected for equipartition. Equipartition
requires that the clouds survive at least several cloud-cloud scattering
times. The latter varies with the local Galactic space density of clouds
but is almost always
108 yr.
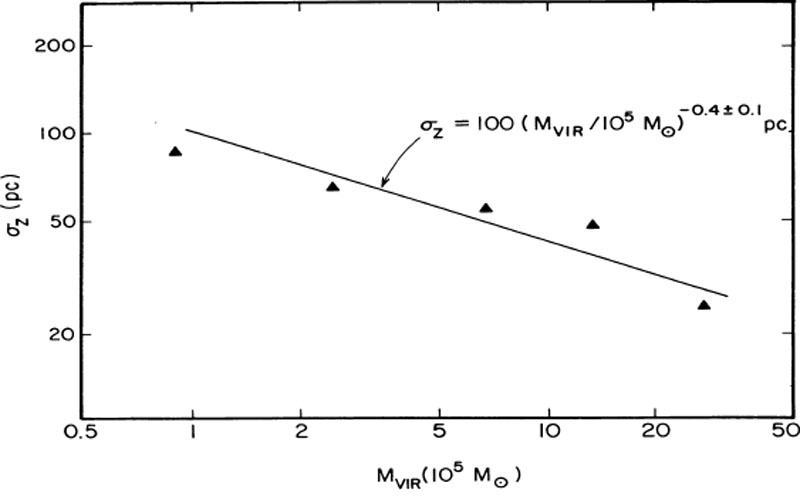 |
Figure 8.6. The scaleheights of the GMC distribution perpendicular to the Galactic disk are shown as a function of cloud virial mass (Scoville et al. 1987). The nearly square-root dependence on cloud mass suggests an equipartition of the cloud kinetic energy distribution, requiring that the GMCs last longer than several 108 yr. |
8.1.3.4. GMC supersonic internal motions
I mentioned earlier that the GMCs have highly supersonic internal
motions as determined from the molecular line Doppler widths and that to
date there is no satisfactory explanation. The long cloud lifetimes
highlight this problem. The maps of molecular emission within individual
clouds show that the molecular emissions and their large velocity spread
are fairly smooth across the projected area of the clouds, implying that
the area covering factor is
1. If this is the
case then the supersonic turbulent gas parcels will necessarily collide
and dissipate their energy with the time it takes to cross the cloud
diameter. This timescale is 40 pc /3 km/s ~ 107 yr. Thus the
turbulent energy required to support the GMCs against gravitational
collapse needs to be replenished within a similar timescale. (Reduction
of the dissipation by postulating that magnetic fields are driving these
motions requires very strong fields and does not change this estimate
significantly since the collisional dissipation can still occur along
the field direction.)
Although the feedback energy released from embedded young stars is of the right order of magnitude to replenish the turbulent energy, most of the energy released from the protostellar outflows is radiated away in high-velocity shock fronts and is also deposited on small length scales rather than scales comparable to the cloud size needed for the large scale support. Turbulent cascades generally transport energy from large scale to small scale (except in 2D turbulence, see Robertson & Goldreich 2012) so it is difficult to see how the stellar feedback can maintain the turbulent energy.
A possible source of the turbulent energy might be large-scale `corrugations' in the galactic plane mass distribution. It should be pointed out that despite the apparent virial equilibrium of the GMCs (in the sense that their gravitational potential energy is approximately twice their internal kinetic energy), the morphologies of the clouds do not appear virialised and spherical - this provides a strong argument that they are constantly being distorted by the external force gradients. Those associated with normal density wave spiral structure pass by only every ~ 2 × 10⁸ yr and are therefore not sufficient. Jog & Ostriker (1988) propose that GMC-GMC scattering is viable to maintain the internal motions but such scattering occurs also on a typical timescale of only every ~ 108 yr, which seems too long compared to the dissipation timescale.
D'Onghia et al. (2011) have recently suggested that many observed spiral structures may be stochastic in nature, where mass seeds corresponding to GMC masses (very likely the GMCs themselves) will induce a mass overdensity in the stellar disk via the swing-amplification process. Is it viable that these associated stellar disk mass enhancements actually feed back gravitational perturbation energy into the internal supersonic motions of the GMC gas?
In summary, the observations of Galactic GMCs and local galaxies indicate that :
M-1.6 with the midpoint in
the mass contributions at cloud diameter ~ 40 pc and mass
4 × 10⁵
M. For
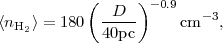
this size cloud, the mean density is
nH2 ~ 180 cm-3 - larger clouds
have lower density and smaller clouds higher mean density.
)1/2 (i.e.,
CO
varying as 1/2 / T) and having much lower than
linear dependence on metallicity.
1 http://www.strw.leidenuniv.nl/~moldata/radex.html Back.