Copyright © 2002 by Annual Reviews. All rights reserved
| Annu. Rev. Astron. Astrophys. 2002. 40:
319-348 Copyright © 2002 by Annual Reviews. All rights reserved |


The presence of a magnetic field in an ionized plasma sets a
preferential direction for the gyration of electrons, leading to
a difference in the index of refraction for
left versus right circularly polarized radiation.
Linearly polarized light propagating through a magnetized plasma
experiences a phase shift of the left versus right circularly
polarized components of the wavefront, leading to a
rotation of the plane of polarization,

 = RM
= RM
 2, where
is the change
in the position angle of polarization,
is the wavelength of
the radiation, and RM is the Faraday rotation measure.
The RM is related to the electron density, ne, and the
magnetic field, B, as:
2, where
is the change
in the position angle of polarization,
is the wavelength of
the radiation, and RM is the Faraday rotation measure.
The RM is related to the electron density, ne, and the
magnetic field, B, as:
 |
(1) |
where B is measured in µGauss, ne in cm-3 and dl in kpc, and the bold face symbols represent the vector product between the magnetic field and the direction of propagation. This phenomenon can also be understood qualitatively by considering the forces on the electrons.
Synchrotron radiation from cosmic radio sources is well known to be linearly polarized, with fractional polarizations up to 70% in some cases (Pacholczyk 1970). Rotation measures can be derived from multifrequency polarimetric observations of these sources by measuring the position angle of the polarized radiation as a function of frequency. The RM values can then be combined with measurements of ne to estimate the magnetic fields. Due to the vector product in Eq. 1, only the magnetic field component along the line-of-sight is measured, so the results depend on the assumed magnetic field topology.
Most extragalactic radio sources exhibit Faraday rotation
measures (RMs) of the order of 10's of rad m-2 due to propagation
of the emission through the interstellar medium of our galaxy
(Simard-Normandin,
Kronberg & Button 1981).
Sources at Galactic latitudes
 5° can exhibit ~ 300
rad m-2. For the past 30 years, however, a small number
of extragalactic sources were known to have far higher RMs than could
be readily explained as Galactic in origin. Large intrinsic RMs were
suspected, but the mechanism(s) producing them were unclear.
5° can exhibit ~ 300
rad m-2. For the past 30 years, however, a small number
of extragalactic sources were known to have far higher RMs than could
be readily explained as Galactic in origin. Large intrinsic RMs were
suspected, but the mechanism(s) producing them were unclear.
Mitton (1971) discovered that the powerful radio galaxy Cygnus A had large, and very different RMs (35 vs -1350 rad m-2), in its two lobes. While its low galactic latitude (5.8°) could possibly be invoked to explain the high RMs, the large difference in RMs over just 2' was difficult to reproduce in the context of Galactic models (Alexander, Brown, & Scott 1984). This "RM anomaly" was clarified when Dreher, Carilli & Perley (1987) performed the first high resolution RM studies with the VLA and found complex structure in the RM distribution on arcsec scales (Fig. 2), with gradients as large as 600 rad m-2 arcsec-1. These large gradients conclusively ruled out a Galactic origin for the large RMs.
 |
Figure 2. The RM distribution in Cygnus A based on multi-frequency, multi-configuration VLA observations. The resolution is 0.35'' (Dreher et al. 1987). The colorbar indicates the range in RMs from -3400 to +4300 rad m-2. Note the undulations in RM on scales of 10-30 kpc. Contours are overlaid from a 5 GHz total intensity image. The RM was solved for by fitting for the change in polarization angle with frequency on a pixel-by-pixel basis (see Fig. 5). |
Perhaps just as important as the observed RM structure across
the lobes of Cygnus A was the discovery that the
observed position angles behave quadratically with wavelength to
within very small errors over a wide range in wavelengths
(Dreher, Carilli
& Perley 1987).
Examples of this
phenomenon are shown in (Fig. 5). Moreover,
the change in position angle from short to long wavelengths is
much larger than  radians in
many cases, while the fractional polarization remains constant. This
result is critical for interpreting the large RMs for cluster center
radio sources, providing rigorous proof that the large RMs cannot be
due to thermal gas mixed with the radio emitting plasma
(Dreher, Carilli
& Perley 1987).
Such mixing would lead to rapid depolarization with increasing
wavelength, and departures from a quadratic behavior of
with wavelength
(Burn 1966).
radians in
many cases, while the fractional polarization remains constant. This
result is critical for interpreting the large RMs for cluster center
radio sources, providing rigorous proof that the large RMs cannot be
due to thermal gas mixed with the radio emitting plasma
(Dreher, Carilli
& Perley 1987).
Such mixing would lead to rapid depolarization with increasing
wavelength, and departures from a quadratic behavior of
with wavelength
(Burn 1966).
The Cygnus A observations were the first to show that the large RMs must arise in an external screen of magnetized, ionized plasma, but cannot be Galactic in origin. Dreher, Carilli & Perley (1987) considered a number of options for the Faraday screen toward Cygnus A, and concluded that the most likely site was the X-ray emitting cluster atmosphere enveloping the radio source (Fabbiano et al. 1979). They found that magnetic fields in the cluster gas of 2-10 µG could produce the observed RMs.
Since the ground-breaking observations of Cygnus A, RM studies of
cluster center radio sources have become a standard tool for
measuring cluster fields. RM studies of radio galaxies in clusters can
be divided into studies of cooling-flow and non-cooling-flow
clusters. Cooling-flow clusters are those in which the X-ray emission
is strongly peaked at the center, leading to high densities and
cooling times of the hot ICM in the inner ~ 100 kpc of
much less than the Hubble time. To maintain hydrostatic equilibrium,
an inward flow may be required
(Fabian, Nulsen,
& Canizares 1991).
Typical mass cooling flow rates are 100
M yr-1. The actual presence of material "cooling" and "flowing"
is a topic that is hotly debated at present
(Binney 2001).
What is more agreed upon is that cooling-flow clusters are more
dynamically relaxed than non-cooling flow clusters
which often show evidence of cluster mergers
(Markovic &
Eilek 2001).
yr-1. The actual presence of material "cooling" and "flowing"
is a topic that is hotly debated at present
(Binney 2001).
What is more agreed upon is that cooling-flow clusters are more
dynamically relaxed than non-cooling flow clusters
which often show evidence of cluster mergers
(Markovic &
Eilek 2001).
Radio galaxies in cooling flow clusters attracted some of the first detailed RM studies by virtue of their anomalously high RMs (e.g., A1795: Ge & Owen 1993; Hydra A: Taylor & Perley 1993). Out of a sample of 14 cooling-flow clusters with strong embedded radio sources (Taylor, Barton & Ge 1994, Taylor et al. 2001b), found that 10 of 14 sources display RMs in excess of 800 rad m-2, two (PKS 0745-191 and 3C 84 in Abell 426) could not be measured due to a lack of polarized flux, and two (Abell 119 Feretti et al. 1999 and 3C 129 Taylor et al. 2001a) have lower RMs, but with better X-ray observations turn out not to be in cooling-flow clusters. Hence, current data are consistent with all radio galaxies at the center of cooling flow clusters having extreme RMs, with the magnitude of the RMs roughly proportional to the cooling flow rate (see Fig. 3).
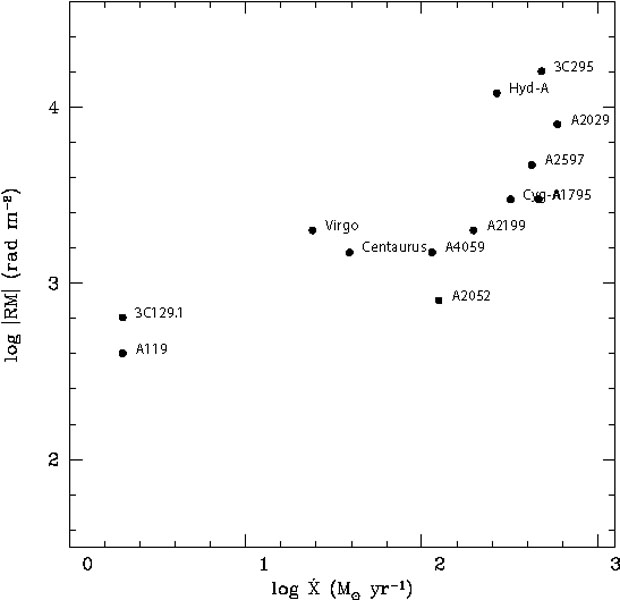 |
Figure 3. The maximum absolute RM plotted as a function of the estimated cooling flow rate, X, for a sample of X-ray luminous clusters with measured RMs from Taylor et al. (2001b). Both RM and X are expected to depend on density to a positive power, so in that sense the correlation is expected. |
The RM distributions for radio sources found at the centers of cooling flow clusters tend to be patchy with coherence lengths of 5-10 kpc (Fig. 4). Larger "patches" up to 30 kpc are seen for example in Cygnus A (Fig. 2). In both Cygnus A and Hydra A one can find "bands" of alternating high and low RM (see Figures 2 and 4). Such bands are also found in the non-cooling flow cluster sources (Eilek & Owen 2001), along with slightly larger coherence lengths of 15-30 kpc. In Hydra A there is a strong trend for all the RMs to the north of the nucleus to be positive and to the south negative. To explain this requires a field reversal and implies a large-scale (100 kpc) ordered component to the cluster magnetic fields in Hydra A. Taylor & Perley (1993) found the large scale field strength to be ~ 7 µG, and more tangled fields to have a strength of ~ 40 µG. A similar RM sign reversal across the nucleus is seen in A1795, although in this case the radio source is only 11 kpc in extent.
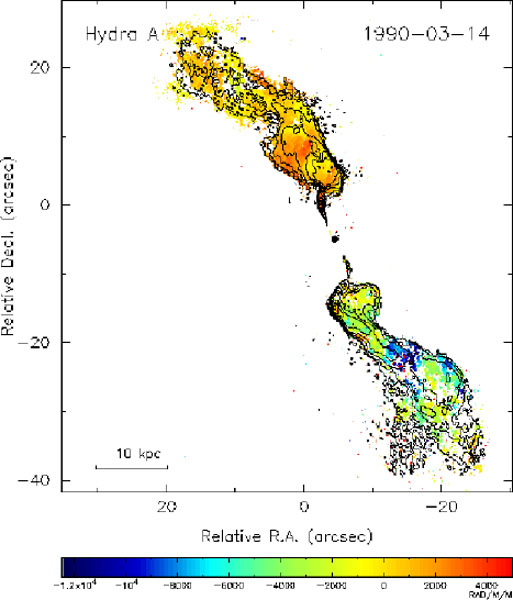 |
Figure 4. The RM distribution in Hydra A at a resolution of 0.3'' (Taylor & Perley 1993) with total intensity contours overlaid. Multi-configuration VLA observations were taken at 4 widely spaced frequencies within the 8.4 GHz band, and a single frequency in the 15 GHz band. The colorbar indicates the range in RMs from -12000 to +5000 rad m-2. |
Minimum cluster magnetic field strengths can be estimated by assuming a constant magnetic field along the line-of-sight through the cluster. Such estimates usually lead to magnetic field strengths of 5 to 10 µG in cooling flow clusters, and a bit less (factor ~ 2) in the non-cooling flow clusters.
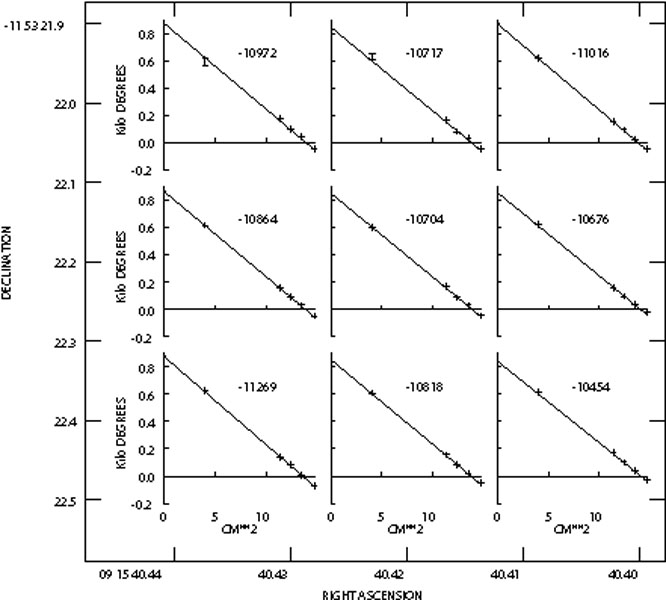 |
Figure 5. The observed position angles,
|
From the patchiness of the RM distributions it is clear that
the magnetic fields are not regularly ordered on cluster (Mpc)
scales, but have coherence scales between 5 and 10 kpc.
Beyond measuring a mean line-of-site field, the next level
of RM modeling entails `cells' of constant size
and magnetic field strength, but random magnetic field
direction, uniformly filling the cluster. The RM
produced by such a screen will be built up in a random walk fashion
and will thus have an average value of 0 rad m-2, but a
dispersion in the RM,
 RM, that is
proportional to the square root of
the number of cells along the line-of-sight through the cluster.
The most commonly-fit form to the X-ray observations to obtain
the radial electron density distribution,
ne(r) through a cluster is the modified King
model
(Cavaliere
& Fusco-Femiano 1976):
RM, that is
proportional to the square root of
the number of cells along the line-of-sight through the cluster.
The most commonly-fit form to the X-ray observations to obtain
the radial electron density distribution,
ne(r) through a cluster is the modified King
model
(Cavaliere
& Fusco-Femiano 1976):
 |
(2) |
where n0 is the central density, rc
is the core radius, and
 is a free
parameter in the fit.
Typical values for these parameters are rc ~ 200 kpc,
~ 2/3, and
no ~ 0.01 cm-3.
is a free
parameter in the fit.
Typical values for these parameters are rc ~ 200 kpc,
~ 2/3, and
no ~ 0.01 cm-3.
For this density profile and cells of constant magnetic strength but random orientation, Felten (1996), Feretti et al. (1995) derived the following relation for the RM dispersion:
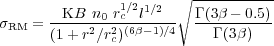 |
(3) |
where l is the cell size, r is the distance of
the radio source from the cluster center,
 is the Gamma function,
and K is a factor which depends on the location of the radio
source along the line-of-sight through the cluster: K = 624
if the source is beyond the cluster, and K = 441 if the source
is halfway through the cluster. Note that Eq. 3 assumes that the magnetic
field strength, B, is related to the component along the
line of sight, (B∥), by B =
√3
B∥. The cell size, l, can be
estimated to first order from the observed coherence lengths
of the RM distributions. Both cooling-flow and non-cooling
flow clusters yield typical estimates of 5 to 10 kpc.
Magnetic field strength estimates, however are two to three
times higher in the cooling-flow clusters - 19 µG
in the 3C 295 cluster
(Allen et
al. 2001a)
compared to 6 µG in the 3C 129 cluster
(Taylor et
al. 2001a)
using the methodology described above.
is the Gamma function,
and K is a factor which depends on the location of the radio
source along the line-of-sight through the cluster: K = 624
if the source is beyond the cluster, and K = 441 if the source
is halfway through the cluster. Note that Eq. 3 assumes that the magnetic
field strength, B, is related to the component along the
line of sight, (B∥), by B =
√3
B∥. The cell size, l, can be
estimated to first order from the observed coherence lengths
of the RM distributions. Both cooling-flow and non-cooling
flow clusters yield typical estimates of 5 to 10 kpc.
Magnetic field strength estimates, however are two to three
times higher in the cooling-flow clusters - 19 µG
in the 3C 295 cluster
(Allen et
al. 2001a)
compared to 6 µG in the 3C 129 cluster
(Taylor et
al. 2001a)
using the methodology described above.
Most radio sources found embedded in clusters are located at the center and identified with a cD galaxy. This relatively high pressure environment has been found in many cases to confine or distort the radio galaxy (Taylor, Barton & Ge 1994), as well as giving rise to extreme RMs. For this same reason the extended radio sources in Hydra A and Cygnus A are unique in that they sample regions over 100 kpc in linear extent. There are, however, a few clusters containing more than one strong, polarized radio source. The cluster Abell 119 (Feretti et al. 1999) contains three radio galaxies. Using an analysis based on Eq. 3 above, (Feretti et al. 1999) find that a magnetic field strength of 6-12 µG extending over 3 Mpc could explain the RM distributions for all 3 sources, although they note that such a field would exceed the thermal pressure in the outer parts of the cluster.
In a reanalysis of the Abell 119 measurements, Dolag et al. (2001) find that the field scales as ne0.9. This power-law behavior is marginally steeper than that expected assuming flux conservation, for which the tangled field scales as ne2/3, and significantly steeper than that expected assuming a constant ratio between magnetic and thermal energy density, for which the tangled field scales as ne1/2 for an isothermal atmosphere. In the 3C 129 cluster there are two extended radio galaxies whose RM observations can be fit by a field strength of 6 µG. Finally in A514, Govoni et al. (2001b) has measured the RM distributions of 5 embedded (and background) radio sources and found cluster magnetic field strengths of 4-9 µG spread over the central 1.4 Mpc of the cluster. If the magnetic field scales with the density raised to a positive power, then the product of B and ne in Eq. 1 implies that the observed rotation measures are heavily weighted by the innermost cells in the cluster (Dreher, Carilli & Perley 1987).
It has been suggested that high RMs may result from an interaction between the radio galaxy and the ICM, such that the RMs are generated locally, and are not indicative of cluster magnetic fields. Bicknell, Cameron & Gingold (1990) proposed a model in which the RM screen is due to a boundary layer surrounding the radio source in which the large magnetic fields within the radio source are mixed with the large thermal densities outside the radio source by Kelvin-Helmholtz waves along the contact discontinuity. This model predicts a Faraday depolarized region of a few kpc extent surrounding the radio source, where the synchrotron emitting material has mixed with the thermal gas. Such a depolarized shell has not been observed to date.
In general, extreme RMs have been observed in sources of very different morphologies, from edge-brightened (Fanaroff-Riley Class II Fanaroff & Riley 1974), to edge darkened (FR I) sources. The models for the hydrodynamic evolution of these different classes of sources are thought to be very different, with the FRII sources expanding supersonically, while the FRI sources expand sub-sonically (Begelman, Blandford, & Rees 1984). This argues that the high RMs are not solely a phenomenon arising due to a local interaction between the radio source and its environment, but are more likely to be a property of the large scale (i.e., cluster) environment. Perhaps the most telling argument against the interaction model is that RM studies of background radio sources seen through cluster atmospheres also indicate µG cluster magnetic fields (see Section 3.2).
While we feel that large RMs for cluster center radio sources most likely arise in the large scale cluster atmosphere, we should point out that there are some cases in which the radio source does appear to compress the gas and fields in the ICM to produce local RM enhancements. For example, there is evidence for an RM enhancement due to the bow shock preceding the radio hot spots in Cygnus A and 3C 194 (Carilli, Perley, & Dreher 1988, Taylor, Inoue, & Tabara 1992). However, even in these cases the implied external (i.e., unperturbed) ICM fields are a few µG.
The first successful demonstration of Faraday rotation of the polarized emission from background radio sources seen through a cluster atmosphere was presented by Vallee, MacLeod, & Broten (1986) for A2319. Vallee, MacLeod, & Broten (1987) combined the RM excess in A2319 with density estimates from X-ray observations by Jones et al. (1979) to estimate a field strength of 2 µG if the field is organized in cells of size 20 kpc. Kim et al. (1990) found that the RMs toward sources within 20' of the Coma cluster center had an enhanced RM dispersion by 38 ± 6 rad m-2. From this excess they derived a magnetic field strength of 2.0 ± 1.1 µG assuming a cell size in the range 7-26 kpc. Feretti et al. (1995) found evidence from the RM distribution of the embedded cluster source NGC 4869 for smaller cell sizes (~ 1 kpc), and subsequently estimated the field strength in Coma to be 6.2 µG.
The most significant work in this area is the recent VLA survey by Clarke et al. (2001), in which they observed radio sources in and behind a representative sample of 16 Abell clusters at z < 0.1. They find enhanced rotation measures on the large majority of the lines of sight within 0.5 Mpc of the cluster centers (Fig. 6), from which they derive an areal filling of the magnetic fields of 95%. Their modeling results in magnetic fields of ~ 5 µG, assuming a cell size of 10 kpc. These clusters were chosen not to have cooling flows, but are otherwise unremarkable in their properties. By observing sources behind the clusters, these observations demonstrate that an embedded powerful radio galaxy is not required to produce significant RMs. Another advantage of this technique is that it permits estimation of the spatial extent of the magnetic fields within the cluster (~ 0.5 Mpc). The areal filling factor of 95% (assuming constant magnetic fields in and among all clusters) suggests a relatively large volume filling factor for the fields, with a formal (extreme) lower limit being about 8% for 10 kpc cell sizes.
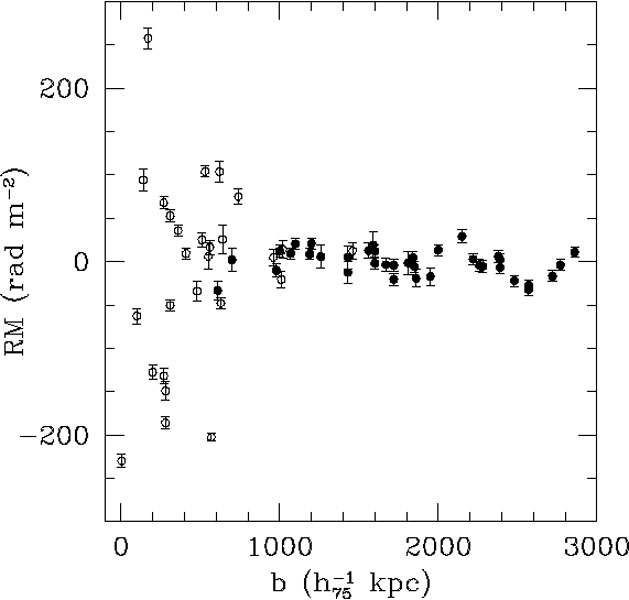 |
Figure 6. The integrated RM plotted as a function of source impact parameter in kiloparsecs for the sample of 16 Abell clusters described in Clarke et al (2001). The open symbols represent sources viewed through the cluster, while the closed symbols represent the control sample of field sources. |
Radio galaxies and radio loud quasars have been detected to z = 5.2 (van Breugel 2000). The extended polarized emission from these sources provides an ideal probe of their environments through Faraday rotation observations. Extensive radio imaging surveys of z > 2 radio galaxies and quasars have shown large rotation measures, and Faraday depolarization, in at least 30% of the sources, indicating that the sources are situated behind dense Faraday screens of magnetized, ionized plasma (Chambers, Miley, & van Breugel 1990, Garrington et al. 1988, Carilli, Owen, & Harris 1994, Carilli et al. 1997, Pentericci et al. 2000, Lonsdale, Barthel, & Miley 1993, Athreya et al. 1998), with a possible increase in this fraction with redshift (Pentericci et al. 2000). Drawing the analogy to lower z radio galaxies, these authors proposed that the high z sources may be embedded in magnetized (proto-) cluster atmospheres, with µG field strengths.
A difficulty with the study of high redshift sources is that the
sources are typically small (< few arcseconds), requiring higher
frequency observations (5 to 8 GHz) in order to properly resolve the
source structure. This leads to two problems. First is that the rest
frame frequencies are then  20 GHz, such that only extreme values of Faraday rotation can be measured
(RM 1000 rad m-2).
And second is that only the
flatter spectrum, higher surface brightness radio emitting structures
in the sources are detected, thereby allowing for only a few
lines-of-site through the ICM as RM probes. Imaging at frequencies of
1.4 GHz or lower with sub-arcsecond resolution is required to address
this interesting issue.
20 GHz, such that only extreme values of Faraday rotation can be measured
(RM 1000 rad m-2).
And second is that only the
flatter spectrum, higher surface brightness radio emitting structures
in the sources are detected, thereby allowing for only a few
lines-of-site through the ICM as RM probes. Imaging at frequencies of
1.4 GHz or lower with sub-arcsecond resolution is required to address
this interesting issue.