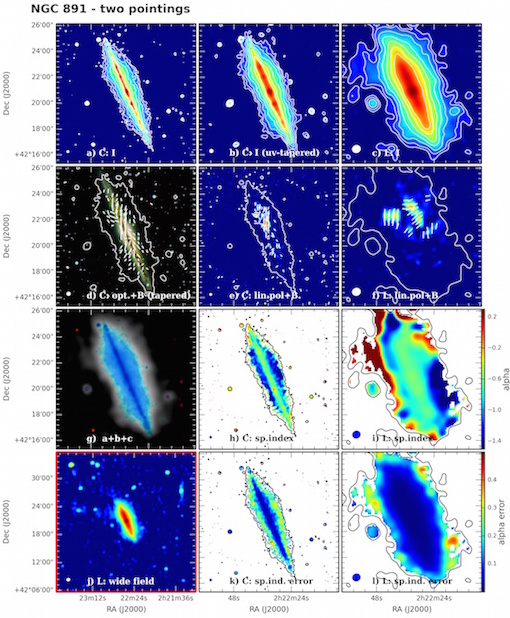
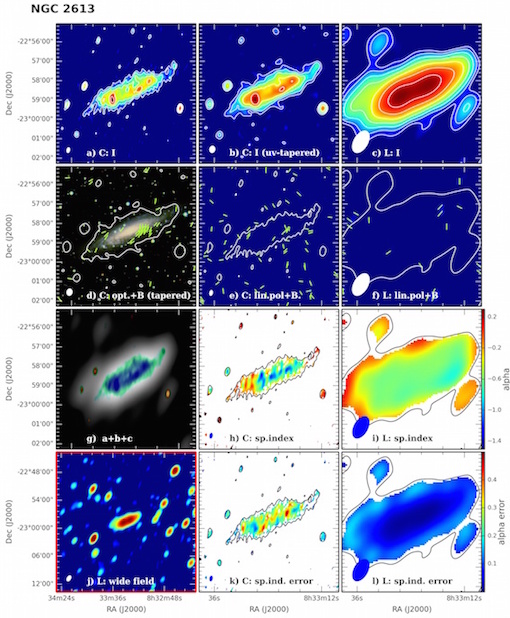
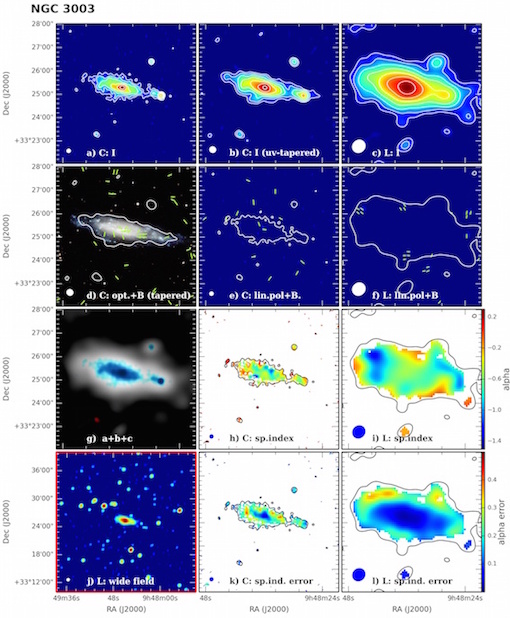
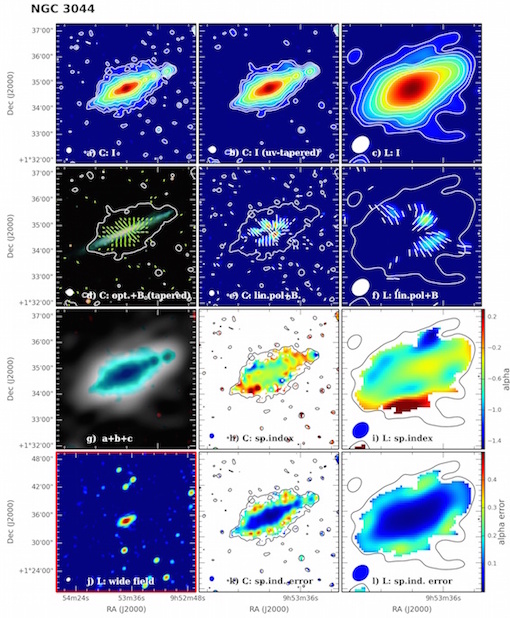
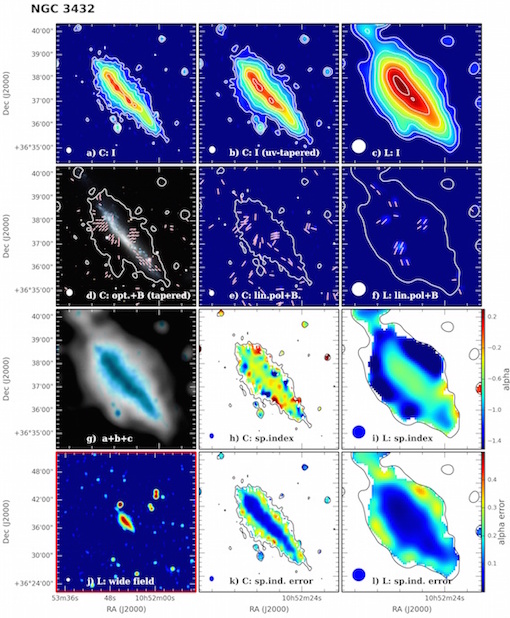
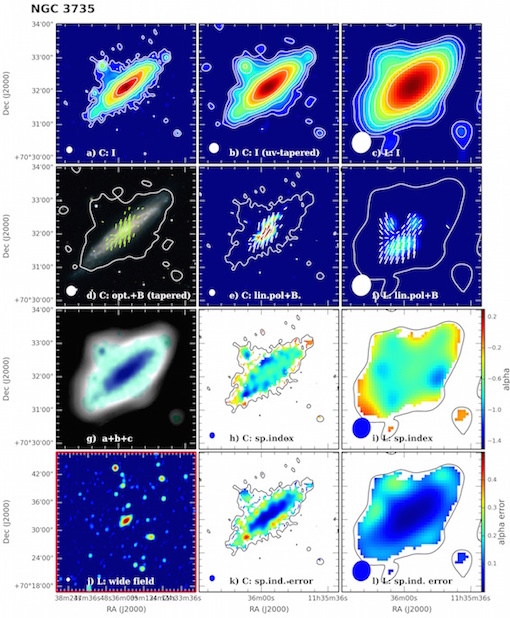
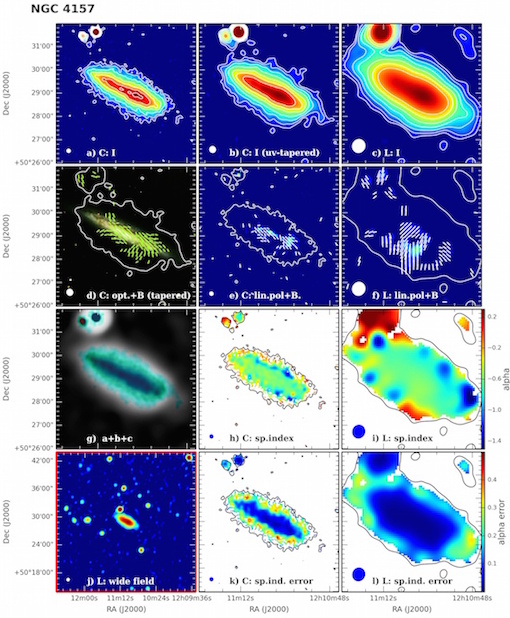
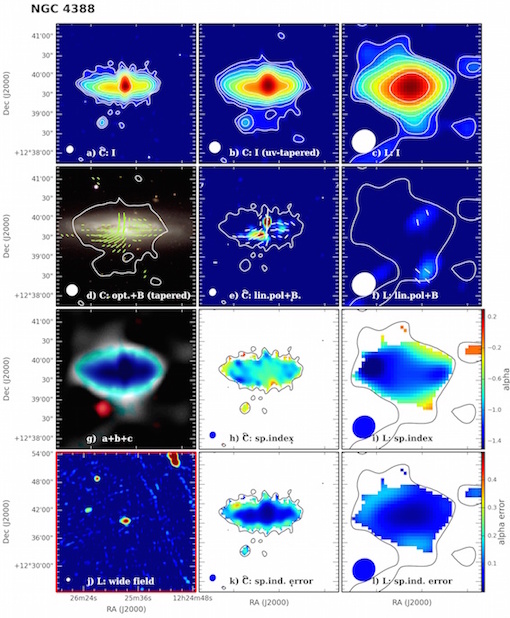
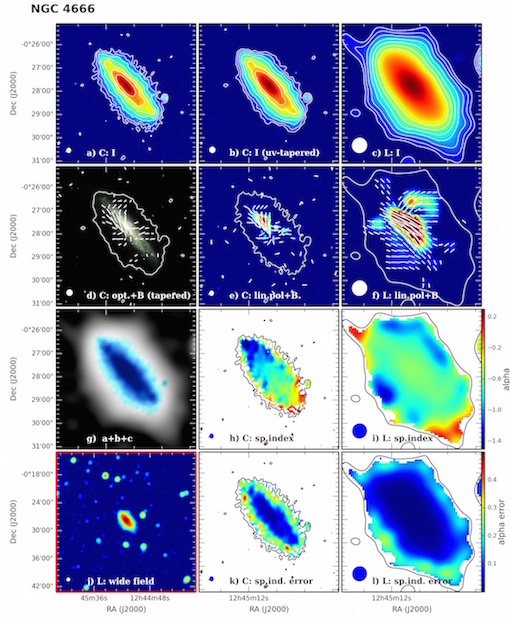
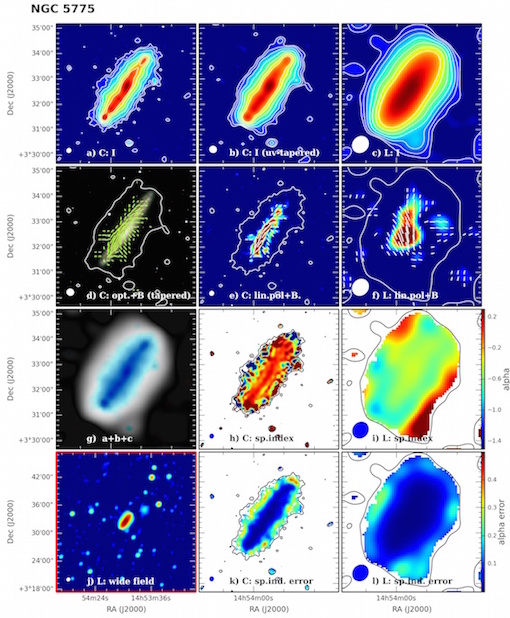
The figures in this appendix display an assortment of the data products from the CHANG-ES project, described below. With the exception of the field panel (j) in the red frame, all panels are displayed in the exact same angular field of view, for better comparison. The ’apparent B-vectors’ in panels (d), (e) and (f) below, are in reality E-vectors rotated by 90 degrees (see Sec. 3.3.3).
First row
a) C-band Stokes I intensity map with a Briggs robust 0 weighting. The I
contours are overlaid for clarity, at 3, 6, 12, 24, 48, 96, 192 times
the rms noise of the map (rms values are listed
Table 4).
b) C-band Stokes I intensity map with a uv-tapering applied onto the
robust 0 weighting, yielding a beam approximately twice the size of that
of the robust 0 weighting in C-band, overlaid with its contours at 3, 6,
12, 24, 48, 96, 192 times the rms noise. This map does not exist for
galaxies NGC 4438 and NGC 4845.
c) L-band Stokes I intensity map, with contours at 3, 6, 12, 24, 48, 96,
192 times the L rms noise (see
Table 5 for rms values).
Second row:
d) C-band Stokes I contours with uv-tapered weighting at 3 times the rms
noise, with apparent B-vectors at the same weighting , overlaid on an
optical image. The optical images were created using a combination of
Sloan Digital Sky Survey (SDSS) g,r,i bands or Digitized Sky
Survey 2 (DSS2) blue red and infrared bands, for the galaxies not
available in SDSS.
e) C-band polarization map with apparent B-vectors and Stokes I contours
at 3σ.
f) L-band polarization map with apparent B-vectors and Stokes I contours
at 3σ.
Third row:
g) Stokes I intensity map with 3 weightings merged (images a, b and c
above). Image a, i.e. C-band with robust 0 weighting, is shown in dark
blue, image (b), i.e. C-band with uv-tapering, is shown in green, and
image c, L-band robust 0 weighting, is shown in white. Except for six
galaxies for which no satisfactory uv-tapered L-band image has been
obtained (see
Table 5 the background has been
masked out using the L-band uv-tapered map (this map is not shown
separately).
h) C-band spectral index map. Spectral indices have been cut off where
formal errors are larger than 1.0, and then smoothed/averaged to the
size of the beam (Section 3.4). The
colour bar of panel i) also applies to this panel.
i) L-band spectral index map. Spectral indices have been cut off where
formal errors are larger than 1.0, and then smoothed/averaged to the
size of the beam (Section 3.4).
Fourth row:
j) The L-band robust 0 surrounding environment. The red frame indicates
that this panel is displayed in a different field of view than the other
panels.
k) Spectral index uncertainty map of (h) - formal error data. See
Section 3.4.3 for more information on
the uncertainties. Note that
although the true error is higher than what is displayed in this map,
the map gives an indication of which regions are to be treated with
caution. The colour bar of panel (l) also applies to this panel.
l) Spectral index uncertainty map of (h) - formal error data. See
caption of panel (k) and Section 3.4.3
for more information on the uncertainties.