

The stars of the bulge of the Milky Way have a broad metallicity distribution, with [Fe/H] between −3.0 and +1 dex. Spectroscopic surveys of the bulge, both high and medium resolution, have reported a metallicity gradient in latitude. This was first measured to be about −0.35 dex kpc−1 along the minor axis of the bulge by Minniti et al (1995), and then −0.6 dex kpc−1 by Zoccali et al. (2008) from observations of about 900 K giants across b = −4∘ to b = −12∘ on the minor axis. Ness et al. (2013a) later found a similar minor axis gradient of −0.45 dex kpc−1 from spectroscopy of about 2000 red clump giants with RGC < 3.5 kpc, across b = −5∘ to b = −10∘. Numerous studies (e.g. Hill et al. 2011; Babusiaux et al. 2010; Gonzalez et al. 2011; Uttenthaler et al. 2012; Rojas-Arriagada et al. 2014; Johnson et al. 2012; Ness et al. 2013a; Bensby et al. 2013) have reported similar MDFs for the bulge. Figure 1, from Bensby et al. (2013) compares the MDFs from a number of different studies in various bulge fields. In addition to the vertical metallicity gradient, there is also a weaker gradient in longitude, at b > 4∘. This is seen in the photometric metallicity distribution by Gonzalez et al. (2013). The vertical abundance gradient was initially interpreted as inconsistent with the formation of the bulge from the disk via dynamical instabilities, which results in a boxy/peanut morphology similar to that already observed in the Milky Way (Dwek et al. 1995). This large abundance gradient was instead interpreted as evidence for a bulge formed via mergers or dissipational collapse (Zoccali et al. 2008).
Subsequently, however, bulge metallicity gradients in (l, b) like those measured for the Milky Way have been shown to be a natural consequence of bulge formation via instability of the disk, due to the preferential redistribution of stars according to their initial phase space energies in the disk Martinez-Valpuesta and Gerhard (2013); Di Matteo et al. (2015). Furthermore, the overall large negative gradient in the mean of the MDF is now believed simply to reflect the changing contribution of populations which have different spatial distributions in the innermost regions. The more metal-rich population of stars is concentrated to the plane, while the more metal-poor populations are present in greater number at larger heights from the plane. Although the various observers find very similar MDFs (see Figure 1), there is no consensus yet in the interpretation of this MDF (see Section 2).
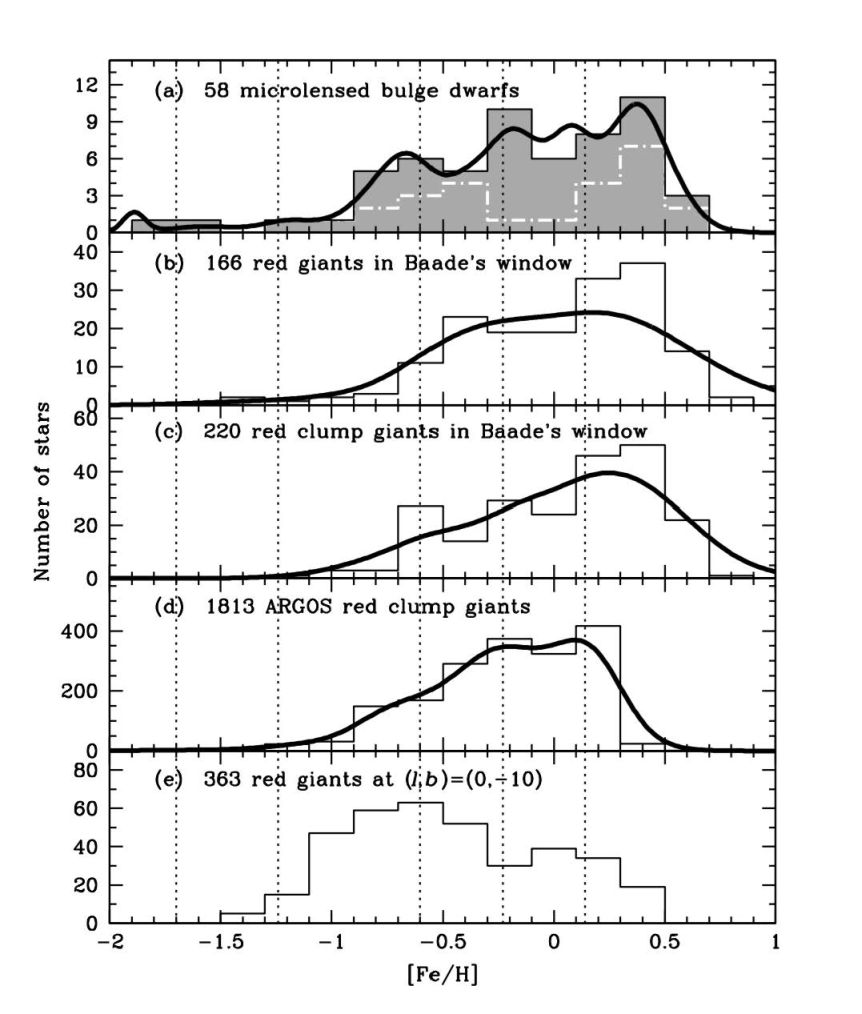 |
Figure 1. Bulge MDFs from several sources assembled by Bensby et al., 2013 showing: a) The MDF for the microlensed dwarf sample (the white dashed line shows the 26 microlensed dwarf stars from Bensby et al. (2011); b) 166 red giant stars in Baade′s window from Hill et al. (2011) c) 220 red clump stars in Baade′s window from Hill et al. (2011) d) 1813 red giant stars from the ARGOS survey fields at (l, b) = (0∘, –5∘), (5∘, –5∘), (–5∘,–5∘) from Ness et al. (2013a); e) 363 red giants at (l, b) = (0, –10∘) from Uttenthaler et al. (2012); The curves are generalised histograms and the dotted lines mark the peaks of the MDF components proposed by Ness et al. (2013a). |
The vertical and (lesser) radial metallicity gradients reported for the MDF in the bulge by numerous studies have been found to flatten for latitudes |b| < 5∘. This was first reported from studies using small samples of stars near the minor axis (Ramírez et al. 2000; Rich et al. 2007; Rich et al. 2012). From the APOGEE survey, it has been revealed that the flattening of the gradient near the plane is seen right across the bulge in longitude, out to l < 10∘ and not just on the minor axis, again for latitudes < 5∘. This is shown in Figure 2 which includes 8500 stars from the APOGEE survey and 8,000 stars from the ARGOS survey (those at positive longitudes where APOGEE has observed). These stars are at distances from 4 to 12 kpc from the Sun, thus showing stars in the bulge region (and stars in the disk away from the Sun to illustrate the smooth transition between the bulge and the disk). The mean [Fe/H] of these stars is shown in Figure 2 (a) and Figure 2 (b) shows the mean [α/Fe]. The ARGOS fields, which each have about 600 stars, are shown in the larger boxes with black outlines for Figure (a) only. There are typically ≥ 30 stars in each of the bins which show the mean measurement for the APOGEE sample.
From Figure 2 (a) it is clear that in the inner region with (l,b) < (10∘, 5∘) the metallicity is nearly constant at constant latitude. The most metal-rich and correspondingly alpha-poor stars are concentrated to the layer b < 2∘, and these metal-rich stars show a smooth transition out into the disk. In the plane, the stars reach the highest metallicity along the thin long bar reported by Wegg et al. (2015), the profile of which is shown by the thin long box in Figure 2, extending out to l = 30∘. The outline of the COBE boxy/bulge profile is shown in this Figure as the larger box, going out to longitudes of l ≈ 10∘. The metallicity measurements for b > 4∘ from APOGEE and ARGOS are in good agreement with the photometric metallicities of Gonzalez et al. (2013)
 |
Figure 2. (a) [Fe/H] and (b) [α/Fe] maps for the 8500 bulge and disk stars from APOGEE and 8000 ARGOS bulge stars (in the larger outlined boxes for the [Fe/H] map only) spanning heliocentric distances of 4–12 kpc. The dashed line indicates approximate outline of the 180 pc thin bar identified by Wegg et al. (2015) and the larger box represents the approximate outline of the boxy bulge in the COBE image (Dwek et al. 1995). |